Asia: India recovers but China & Japan bearish
By Colin Twiggs
August 14th, 2012 1:00 a.m. ET (3:00 p.m. AET)
These extracts from my trading diary are for educational purposes and should not be interpreted as investment or trading advice. Full terms and conditions can be found at Terms of Use.
India's Sensex broke resistance at 17500, signaling a primary up-trend. Expect an advance to 18500*. Rising 13-week Twiggs Money Flow — above zero — indicates strong buying pressure.
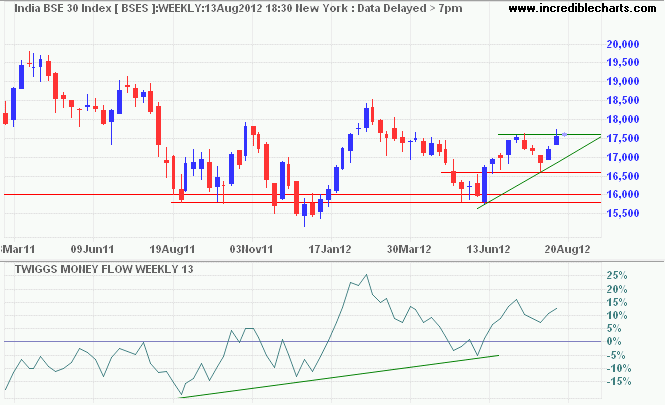
* Target calculation: 17.5 + ( 17.5 - 16.5 ) = 18.5
NSE Nifty is testing resistance at 5350. Breakout would confirm the Sensex primary up-trend. Rising 63-Day Twiggs Momentum is promising but we need a trough above zero to signal a strong up-trend. Target for the breakout would be 5650*.
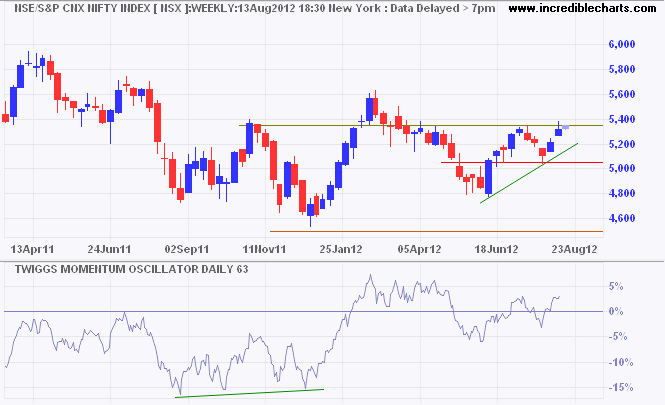
* Target calculation: 5350 + ( 5350 - 5050 ) = 5650
Understanding Momentum
Momentum is an oscillator, so you would expect equal peaks if the trend is constant. If oscillating above zero, it would be a constant up-trend; below zero, a constant down-trend; with zero at the mid-point, a ranging market. Divergence should ideally show a clear transition from one to the other or at least a sharp difference in the height of peaks or troughs. A trendline drawn under rising momentum will indicate that momentum is accelerating; a trendline break would indicate slowing acceleration — not necessarily a reversal.
Japan's Nikkei 225 index is testing resistance at 9000 but 13-week Twiggs Money Flow continues to warn of strong selling pressure, with a peak below zero. Breakout above 9000 is unlikely, but would signal an advance to 10000. Failure of support at 8200 would indicate another test of the 2008/2009 lows at 7000*.
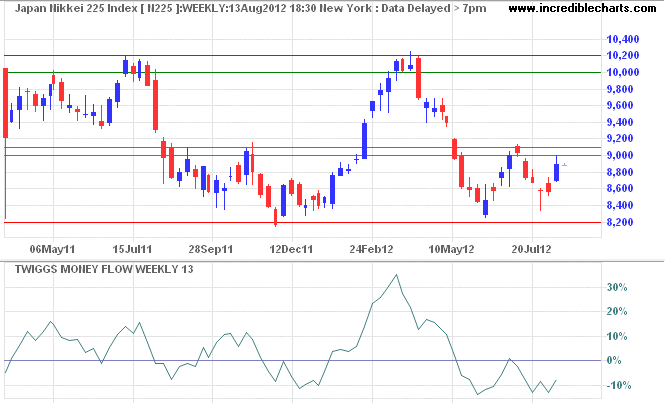
* Target calculation: 8000 - ( 9000 - 8000 ) = 7000
China's Shanghai Composite Index retreated below support at 2150; follow-through below 2100 would indicate a decline to 2000*. Declining 63-day Twiggs Momentum continues to signal a primary down-trend.
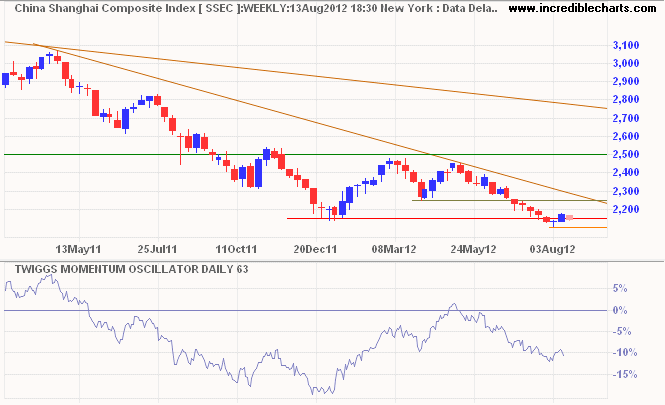
* Target calculation: 2250 - ( 2500 - 2250 ) = 2000
Hong Kong's Hang Seng Index is more bullish, consolidating above resistance at 20000. Follow-through would indicate an advance to 22000*. Recovery of 63-Day Twiggs Momentum above zero would suggest a primary up-trend.
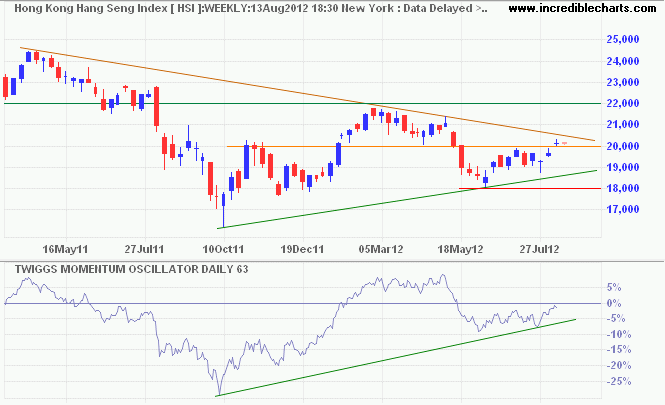
* Target calculation: 20 + ( 20 - 18 ) = 22
Singapore's Straits Times Index is similarly consolidating above former resistance at 3040. Rising 63-day Twiggs Momentum — above zero — indicates the primary up-trend is intact. Calculated target is 3300* but the trend channel suggests resistance at 3200.
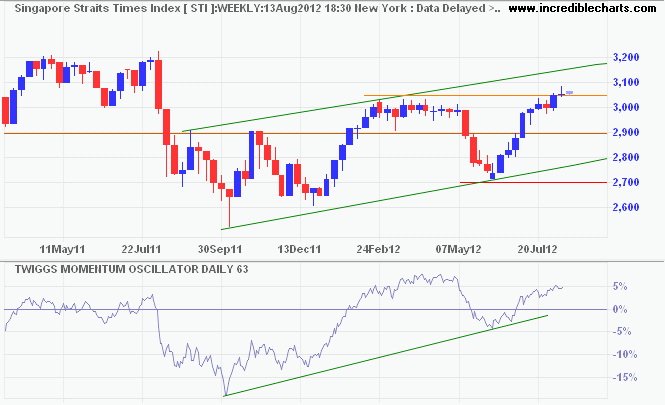
* Target calculation: 3000 + ( 3000 - 2700 ) = 3300
No man is free who is not master of himself.
~ Epictetus.

Author: Colin Twiggs is a former investment banker with almost 40 years of experience in financial markets. He co-founded Incredible Charts and writes the popular Trading Diary and Patient Investor newsletters.
Using a top-down approach, Colin identifies key macro trends in the global economy before evaluating selected opportunities using a combination of fundamental and technical analysis.
Focusing on interest rates and financial market liquidity as primary drivers of the economic cycle, he warned of the 2008/2009 and 2020 bear markets well ahead of actual events.
He founded PVT Capital (AFSL No. 546090) in May 2023, which offers investment strategy and advice to wholesale clients.
