Dollar and gold strengthen
By Colin Twiggs
July 26th, 2012 4:30 a.m. ET (6:30 p:m AET)
These extracts from my trading diary are for educational purposes and should not be interpreted as investment or trading advice. Full terms and conditions can be found at Terms of Use.
The US Dollar Index broke resistance at 83.50, signaling continuation of the primary advance to the 2010 high at 88.50, with an interim target of 86.00*. 63-Day Twiggs Momentum oscillating above zero reinforces the up-trend.
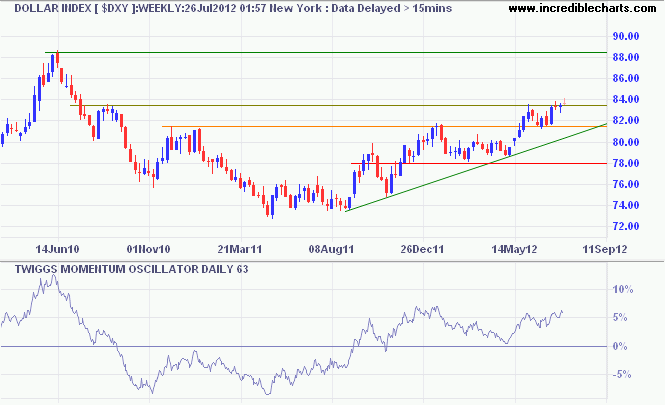
* Target calculation: 82 + ( 82 - 78 ) = 86
Spot Gold shows strong support at $1530 per ounce and penetration of the descending trendline now suggests that a bottom is forming — possibly in anticipation of further QE by the Fed. 63-Day Twiggs Momentum below zero continues to warn of a primary down-trend, while recovery above zero would confirm that a bottom is forming. Breakout below primary support at $1530 would offer a target of $1300*; recovery above $1640 would indicate a new up-trend.
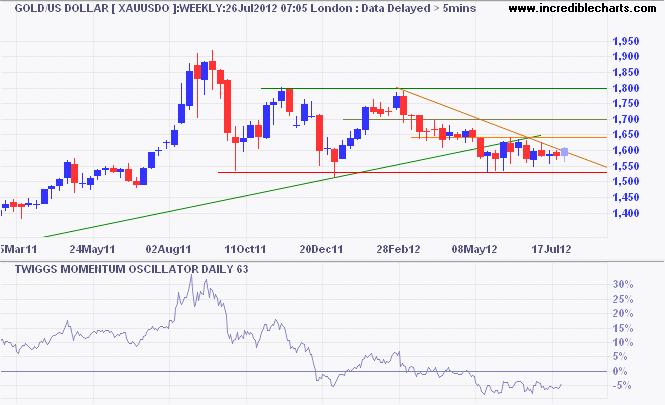
* Target calculation: 1550 - ( 1800 - 1550 ) = 1300
Spot Silver is weaker and continues to test primary support at $26 per ounce. Failure would offer a target of $16*.
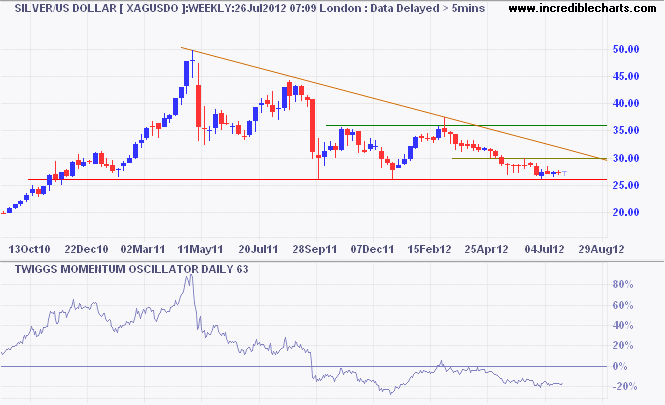
* Target calculation: 26 - ( 36 - 26 ) = 16
The CRB Commodities Index is testing its descending trendline. Breakout would warn that the down-trend is ending, but reversal below 295 would suggest another test of 265. The S&P 500 is likely to follow commodities lower.
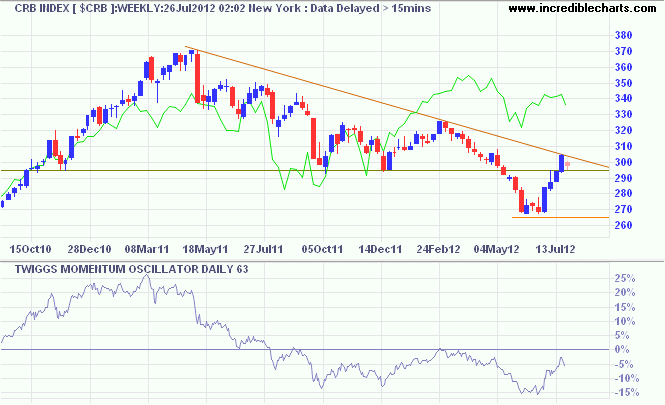
* Target calculation: 265 - ( 305 - 265 ) = 225
Brent Crude has already penetrated its descending trendline, suggesting that a bottom is forming, but 63-day Twiggs Momentum continues to indicate a primary down-trend. A peak below zero would signal a primary decline to $75 per barrel*.
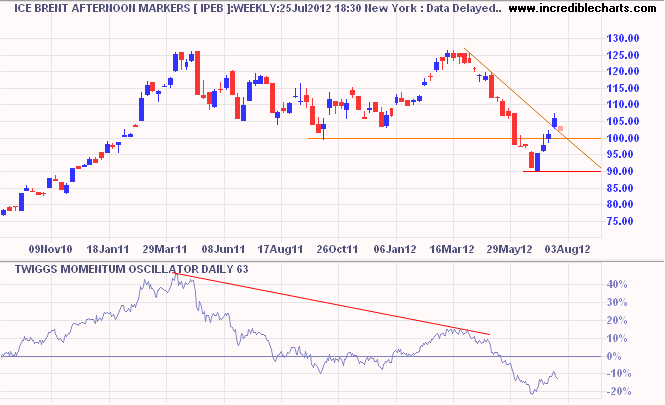
* Target calculation: 100 - ( 125 - 100 ) = 75
It is not the strongest of the species that survives, nor the most intelligent that survives. It is the one that is the most adaptable to change.
~ Charles Darwin

Author: Colin Twiggs is a former investment banker with almost 40 years of experience in financial markets. He co-founded Incredible Charts and writes the popular Trading Diary and Patient Investor newsletters.
Using a top-down approach, Colin identifies key macro trends in the global economy before evaluating selected opportunities using a combination of fundamental and technical analysis.
Focusing on interest rates and financial market liquidity as primary drivers of the economic cycle, he warned of the 2008/2009 and 2020 bear markets well ahead of actual events.
He founded PVT Capital (AFSL No. 546090) in May 2023, which offers investment strategy and advice to wholesale clients.
