Commodity and stock prices diverge
By Colin Twiggs
May 3rd, 2012 6:00 a.m. ET (8:00 p:m AET)
These extracts from my trading diary are for educational purposes and should not be interpreted as investment or trading advice. Full terms and conditions can be found at Terms of Use.
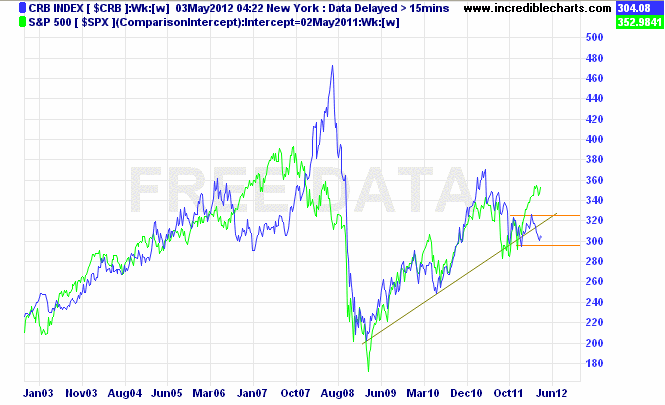
We had an interesting discussion last week about the correlation between commodities and stocks. The weekly chart below shows how CRB Commodities Index closely tracks the S&P 500 — except in times of extreme volatility like 2007/2008. We are now witnessing another divergence, with the CRB headed for a test of primary support at 295 while the S&P 500 strengthens. Does weak demand for commodities indicate that stocks are over-priced as in 2007? The Fed has been doing its best to depress bond yields, pumping up stock prices ahead of the November election. It is too early to tell what the outcome will be, but we need to monitor this relationship through the year.

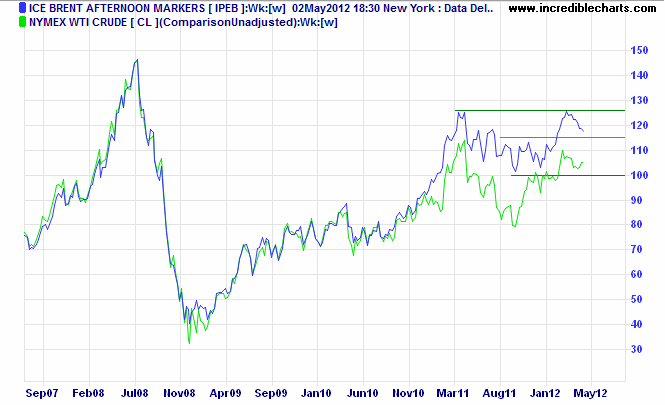
The divergence between Brent Crude and Nymex Light Crude, from early 2011, continues. Both are in a primary up-trend, however, and breakout above the 2011 Nymex high would threaten the still fragile US recovery, offering a long-term target of $140/barrel. Brent is currently testing medium-term support at $115, but respect of this would also confirm a primary up-trend.

It's plain hokum. If you can't convince 'em, confuse 'em. It's an old political trick. But this time it won't work.
~ Harry Truman

Author: Colin Twiggs is a former investment banker with almost 40 years of experience in financial markets. He co-founded Incredible Charts and writes the popular Trading Diary and Patient Investor newsletters.
Using a top-down approach, Colin identifies key macro trends in the global economy before evaluating selected opportunities using a combination of fundamental and technical analysis.
Focusing on interest rates and financial market liquidity as primary drivers of the economic cycle, he warned of the 2008/2009 and 2020 bear markets well ahead of actual events.
He founded PVT Capital (AFSL No. 546090) in May 2023, which offers investment strategy and advice to wholesale clients.
