Gold falls as the Dollar rises
By Colin Twiggs
March 15th, 2012 1:00 a.m. ET (5:00 p:m AET)
These extracts from my trading diary are for educational purposes and should not be interpreted as investment or trading advice. Full terms and conditions can be found at Terms of Use.
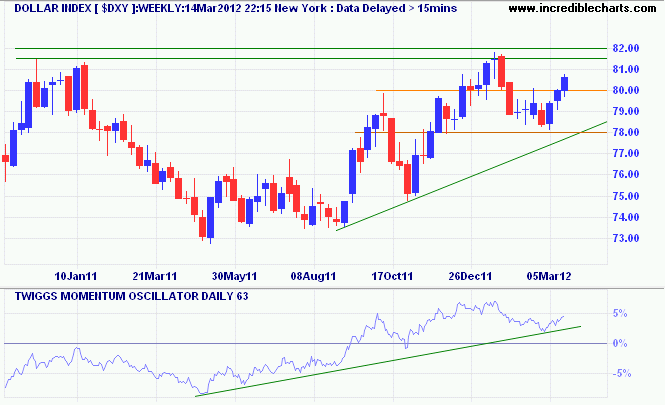
The US Dollar Index broke resistance at 80 on the Weekly chart, signaling an advance to 82. The Index is already in a primary up-trend, as indicated by 63-day Twiggs Momentum above zero. Breakout above 82 would offer a target of 86*.

* Target calculation: 82 + ( 82 - 78 ) = 86
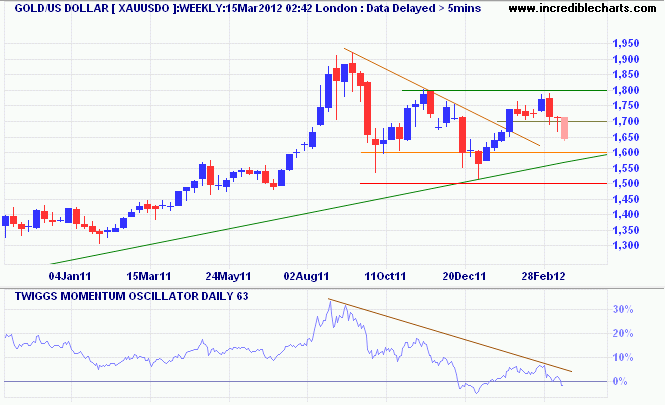
Spot Gold followed through below last week's low, indicating a correction to test primary support at 1500. Respect of the long-term rising trendline would indicate the primary up-trend is intact, but reversal of 63-day Twiggs Momentum below zero for a second time warns of a down-trend. Target for a down-trend would be 1200 to 1400*.

* Target calculation: 1600 - ( 1800 - 1600 ) = 1400
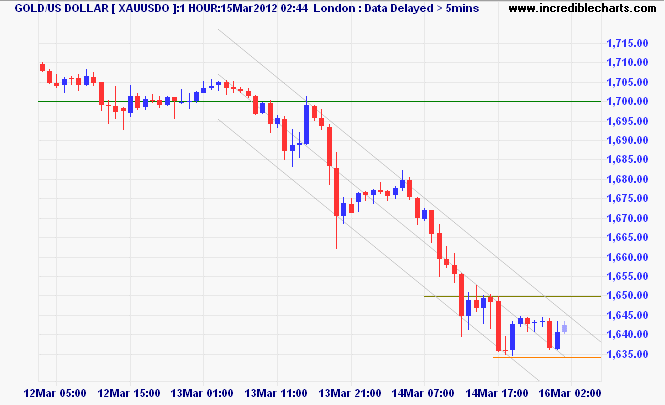
The Hourly chart shows short-term support at 1635 and resistance at 1650. Failure of support would test 1600, while upward breakout from the trend channel would signal retracement to test the new resistance level.

Ah, this is obviously some strange usage of the word 'safe' that I wasn't previously aware of.
~ Douglas Adams

Author: Colin Twiggs is a former investment banker with almost 40 years of experience in financial markets. He co-founded Incredible Charts and writes the popular Trading Diary and Patient Investor newsletters.
Using a top-down approach, Colin identifies key macro trends in the global economy before evaluating selected opportunities using a combination of fundamental and technical analysis.
Focusing on interest rates and financial market liquidity as primary drivers of the economic cycle, he warned of the 2008/2009 and 2020 bear markets well ahead of actual events.
He founded PVT Capital (AFSL No. 546090) in May 2023, which offers investment strategy and advice to wholesale clients.
