Brent crude headed for $145
By Colin Twiggs
March 8th, 2012 4:30 a.m. ET (8:30 p:m AET)
These extracts from my trading diary are for educational purposes and should not be interpreted as investment or trading advice. Full terms and conditions can be found at Terms of Use.
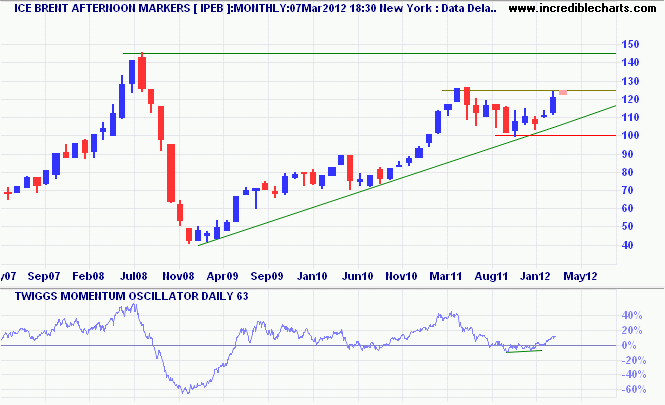
The long-term, monthly chart shows Brent crude testing resistance at $125/barrel. Breakout would signal an advance to the 2008 high of $145. With 63-day Twiggs Money Flow (above zero) flagging a primary up-trend, respect of resistance is unlikely but would indicate another test of the rising green trendline, above $110.

* Target calculation: 125 + ( 125 - 100 ) = 150
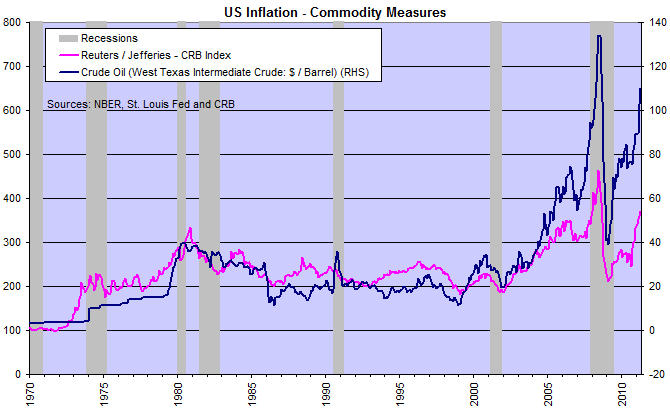
I warned in May last year that every spike in crude oil prices over the last 40 years has been followed by a recession. Reading an article today by James Hamilton, he maintains that:
"There is a good deal of statistical evidence... that an oil price increase that does no more than reverse an earlier decline has a much more limited effect on the economy than if the price of oil surges to a new all-time high."
I can find no evidence to support this, especially when two spikes below the 1980 high of $40/barrel — in 1990 and 2000 — both resulted in recessions:

There is a theory which states that if ever anybody discovers exactly what the Universe is for and why it is here, it will instantly disappear and be replaced by something even more bizarre and inexplicable. There is another theory which states that this has already happened.
~ Douglas Adams

Author: Colin Twiggs is a former investment banker with almost 40 years of experience in financial markets. He co-founded Incredible Charts and writes the popular Trading Diary and Patient Investor newsletters.
Using a top-down approach, Colin identifies key macro trends in the global economy before evaluating selected opportunities using a combination of fundamental and technical analysis.
Focusing on interest rates and financial market liquidity as primary drivers of the economic cycle, he warned of the 2008/2009 and 2020 bear markets well ahead of actual events.
He founded PVT Capital (AFSL No. 546090) in May 2023, which offers investment strategy and advice to wholesale clients.
