Dow and S&P 500 test key resistance
By Colin Twiggs
February 13th, 2012 4:00 a.m. ET (9:00 p.m. AET)
These extracts from my trading diary are for educational purposes and should not be interpreted as investment or trading advice. Full terms and conditions can be found at Terms of Use.
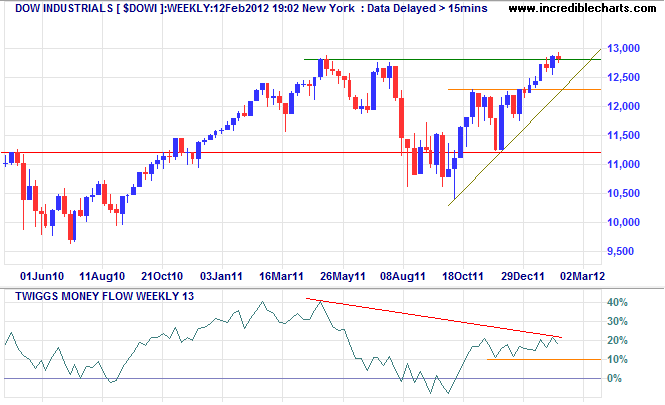
Dow Jones Industrial Average is testing resistance at 12800. A large bearish divergence would be completed if 13-week Twiggs Money Flow retreated below 10% — and would warn of a bull trap. Reversal below medium-term support at 12300 and the rising trendline would also warn of trend weakness, while respect of these levels would indicate a primary advance to 13400*.

* Target calculations: 12300 + ( 12300 - 11200 ) = 13400
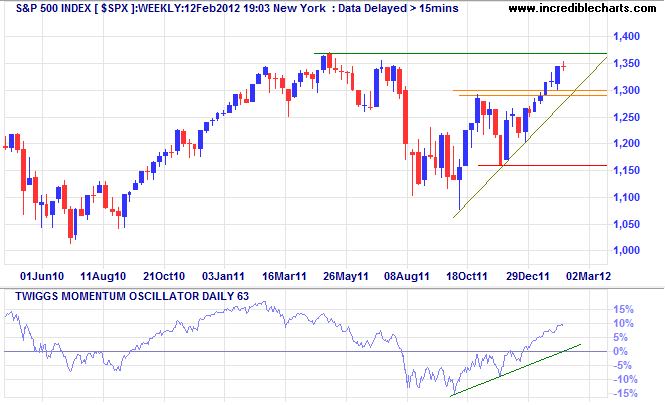
The S&P 500 displays similar weakness on 13-week Twiggs Money Flow, but rising 63-day Twiggs Money Flow indicates trend strength. Breakout above 1370 would indicate an advance to 1450*.

* Target calculations: 1300 + ( 1300 - 1150 ) = 1450
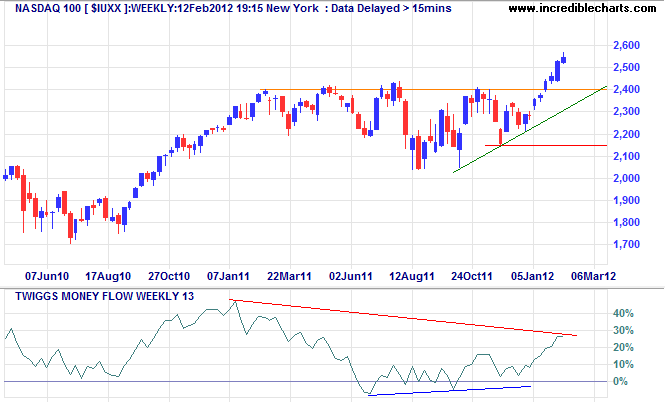
The Nasdaq 100 made a strong breakout above 2400, indicating a primary up-trend. Expect a retracement to test the new support level (2400); respect would confirm the up-trend.

* Target calculations: 2400 + ( 2400 - 2150 ) = 2650
I have but one passion: to enlighten those who have been kept in the dark, in the name of humanity which has suffered so much and is entitled to happiness. My fiery protest is simply the cry of my very soul. Let them dare, then, to bring me before a court of law and let the enquiry take place in broad daylight! I am waiting.
~ Emile Zola: J'accuse! (1898)

Author: Colin Twiggs is a former investment banker with almost 40 years of experience in financial markets. He co-founded Incredible Charts and writes the popular Trading Diary and Patient Investor newsletters.
Using a top-down approach, Colin identifies key macro trends in the global economy before evaluating selected opportunities using a combination of fundamental and technical analysis.
Focusing on interest rates and financial market liquidity as primary drivers of the economic cycle, he warned of the 2008/2009 and 2020 bear markets well ahead of actual events.
He founded PVT Capital (AFSL No. 546090) in May 2023, which offers investment strategy and advice to wholesale clients.
