Bull market signaled as liquidity soars
By Colin Twiggs
February 6th, 2012 2:00 a.m. ET (6:00 p.m. AET)
These extracts from my trading diary are for educational purposes and should not be interpreted as investment or trading advice. Full terms and conditions can be found at Terms of Use.
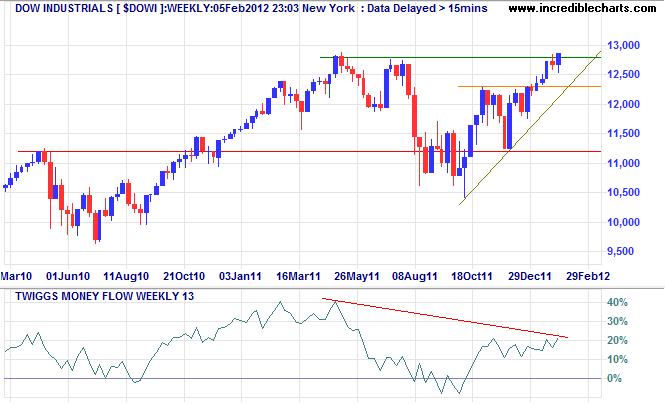
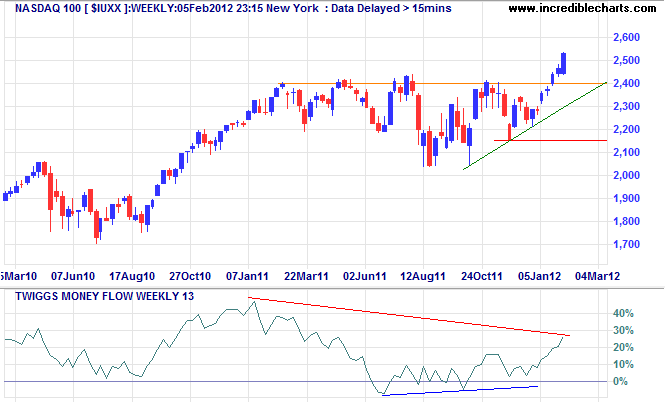
Central banks are flooding the markets with liquidity, causing stocks to rise despite week fundamentals. Large bearish divergences on 13-week Twiggs Money Flow for Dow Industrials and the Nasdaq 100 highlight the precarious nature of the current rally. But, as I said earlier, don't bet on this ending before the November election.
Dow Jones Industrial Average broke resistance at 12800, joining the Nasdaq 100 above its 2011 high. All four major indices display a primary up-trend, collectively signaling a bull market. Rising 13-week Twiggs Money Flow indicates medium-term buying pressure on the Dow and target for the initial advance is 13400*.

* Target calculations: 12300 + ( 12300 - 11200 ) = 13400
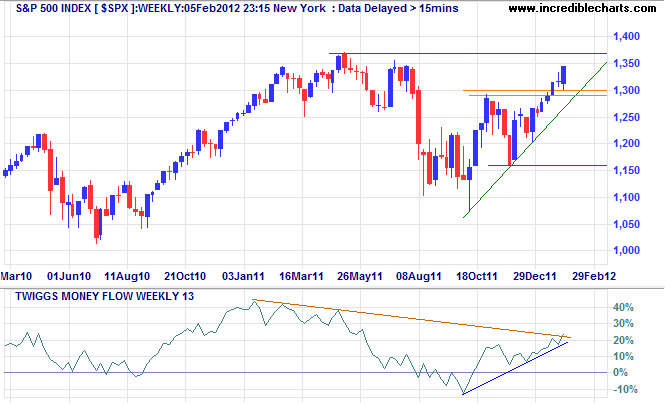
The S&P 500 is a little way behind, but rising 13-week Twiggs Money Flow indicates buying pressure. Breakout above 1370 is likely to confirm an advance to 1450*.

* Target calculations: 1300 + ( 1300 - 1150 ) = 1450
The Nasdaq 100 index followed through above 2500, confirming the primary up-trend, while rising 13-week Twiggs Money Flow indicates medium-term buying pressure.

* Target calculations: 2400 + ( 2400 - 2150 ) = 2650
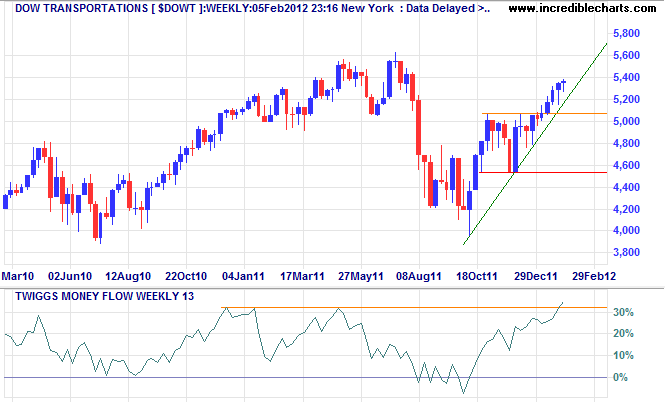
Dow Jones Transport Average is also in a primary up-trend; and headed for a test of resistance at 5600. New highs on 13-week Twiggs Money Flow indicate long-term buying pressure.

* Target calculations: 5000 + ( 5000 - 4500 ) = 5500
The truth is on the march and nothing will stop it.
~ Emile Zola

Author: Colin Twiggs is a former investment banker with almost 40 years of experience in financial markets. He co-founded Incredible Charts and writes the popular Trading Diary and Patient Investor newsletters.
Using a top-down approach, Colin identifies key macro trends in the global economy before evaluating selected opportunities using a combination of fundamental and technical analysis.
Focusing on interest rates and financial market liquidity as primary drivers of the economic cycle, he warned of the 2008/2009 and 2020 bear markets well ahead of actual events.
He founded PVT Capital (AFSL No. 546090) in May 2023, which offers investment strategy and advice to wholesale clients.
