Big trends and their impact in 2012
By Colin Twiggs
January 5th, 2012 5:00 a.m. ET (9:00 p.m. AET)
These extracts from my trading diary are for educational purposes and should not be interpreted as investment or trading advice. Full terms and conditions can be found at Terms of Use.
To arrive at an outlook for the year ahead we first need to analyze the big trends that endure for decades and in some cases even longer.
Population growth and food resources
The number one dynamic over the last century has been the exponential rise in global population. It took 123 years for the world population to grow from 1 to 2 billion (by 1927) and only 12 years to grow from 5 to 6 billion (by 1999). Growth, however, is now slowing and we are predicted to rise from the current 7 billion to a peak of 9 billion in the 2050s.
At the same time we are faced with increasing scarcity of food and water. Advances in technology have improved crop yields, but increased meat consumption in China and other Asian economies will reduce overall output. The area of land required to produce an equivalent amount of edible protein from livestock is 4 to 5 times higher compared to traditional grains and legumes, and up to 10 times higher for beef. Diversion of land use for ethanol production will also restrict food output.
Global warming, whether man-made or a natural cycle, may also contribute to declining food production — through droughts, floods and depleting fish stocks.
Depleting natural resources
We are also depleting global deposits of ferrous- and non-ferrous ores — as well as energy reserves of crude oil and coal — as global industrialization accelerates. Commodity costs can be expected to rise as readily available resources are depleted and we are forced to dig deeper and endure harsher conditions in order to access fresh deposits. Deep water ocean-drilling and exploration within the Arctic and Antarctic circles are likely to increase.
As energy resources are depleted, nuclear energy production is likely to expand despite current safety concerns. Development of technologies such as thorium fluoride reactors hold out some hope of safer nuclear options, but these may be some way off. Wind and solar energy are likely to remain on the fringe until technology develops to the point where they are cost effective compared to alternative sources.
Global competition
Competition for scarce resources will increase tensions between major economic players, with each attempting to expand their sphere of influence — and secure their sources of supply. The Middle East, Africa, South America, Australia, Mongolia and the former USSR are all potential targets because of their rich resource base.
Trade wars
In addition to competition for scarce resources, we are also likely to see increased competition for international trade. Resistance to further currency manipulation — initiated by Japan in the 1980s and perpetuated by China in the last decade — is likely to rise. US Treasury holdings by China and Japan currently sit at more than $2.3 Trillion, the inflows on capital account being used to offset outflows on current account and maintain a competitive trade advantage by suppressing their exchange rate.
Rise of democracy
Another factor contributing to instability is the rise of democracy in some parts of the world. The Arab Spring is still in its infancy, but the development has no doubt caused concern amongst autocratic governments around the globe. Food shortages and rising global prices will act as a catalyst. The likely result is increased suppression in some autocracies and a rapid transition to democracy in others, like Myanmar. But the transition to democracy is never smooth — especially in countries with clear fault lines, such as language, religious, racial or cultural differences — and can lead to decades of conflict before some degree of stability is achieved.
The path to recovery: how to bring the debt binge under control
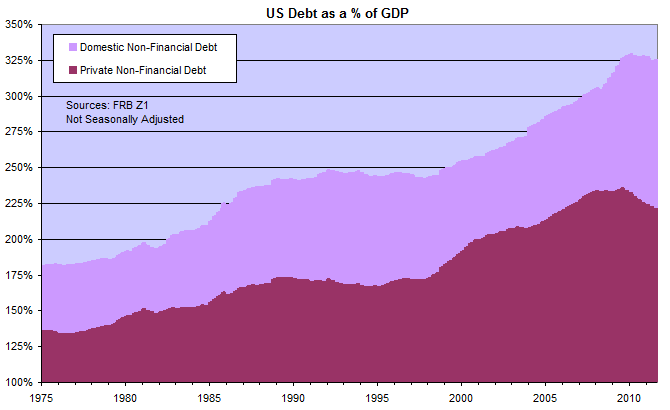
The debt binge since 1975, fueled by an easy-money policy from the Fed, has landed the US economy in serious difficulties. Wall Street no doubt lobbied hard for debt expansion, because of the boost to interest margins, with little thought as to their own vulnerability. There can be no justification for debt to expand at a faster rate than GDP — a rising Debt to GDP ratio — as this feeds through into the money supply, causing asset (real estate and stocks) and/or consumer prices to balloon. What we see here is clear evidence of financial mismanagement of the US economy over several decades: the graph of debt to GDP should be a flat line.

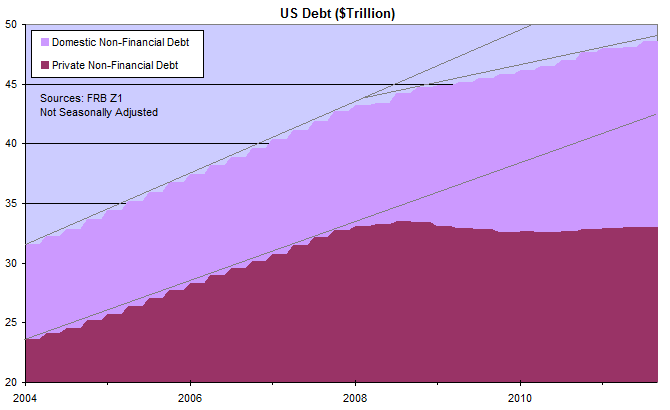
The difference between domestic and private (non-financial) debt is public debt, comprising federal, state and municipal borrowings. When we look at aggregate debt below, domestic (non-financial) debt is still rising, albeit at a slower pace than the 8.2 percent average of the previous 5 years (2004 to 2008). Public debt is ballooning in an attempt to mitigate the deflationary effect of a private debt contraction. Clearly this is an unsustainable path.

The economy has grown addicted to debt and any attempt to go "cold turkey" — cutting off further debt expansion — will cause pain. But there are steps that can be taken to alleviate this.
Australia: The significance of tax components within your SMSF — Warrick Hanley
Have you ever taken note of the tax components within your SMSF? Behind the balance of your member account are two main components that make up your superannuation savings — these are the Taxable Component and the Exempt (or Tax Free) Component.
The Taxable bucket consists of contributions made to superannuation where a tax deduction has been claimed (i.e. SGC, salary sacrifice, personal deductible contributions) and the Exempt bucket is made up of after-tax contributions. Contributions where a tax deduction has been claimed are officially referred to as Concessional Contributions and after-tax contributions referred to as Non-Concessional Contributions.
Whilst your member balance is in accumulation phase (i.e. where you are not drawing an income) all positive and negative investment earnings will effectively be allocated to or from the Taxable Component. Then, once you eventually commence an income stream, the proportion of your components will freeze and the income stream will forever maintain the same proportion to each component.
For example, if you had an accumulation balance of $440,000 in year 1 made up of a $375,000 Exempt Component (85% of balance) and a $65,000 Taxable Component (15% of balance) and during that year earnings allocated to your balance amounted to $60,000, then your new account balance would be $500,000 and the $60,000 would be added to your Taxable Component - $125,000 (25% of balance). The Exempt Component would remain at $375,000 (75% of balance).
Let's say at the beginning of year 2, you retire and decide to commence an income stream with your total balance. When you commence an income stream, the proportions of your income stream balance will remain as they were when it started (25%/75%) and all earnings will also be allocated proportionately. Furthermore, any withdrawals will need to be made proportionately. The effect of this is that your income stream account will always remain 25% Taxable/75% Exempt.
Peace comes from within. Do not seek it without.
~ Buddha

Author: Colin Twiggs is a former investment banker with almost 40 years of experience in financial markets. He co-founded Incredible Charts and writes the popular Trading Diary and Patient Investor newsletters.
Using a top-down approach, Colin identifies key macro trends in the global economy before evaluating selected opportunities using a combination of fundamental and technical analysis.
Focusing on interest rates and financial market liquidity as primary drivers of the economic cycle, he warned of the 2008/2009 and 2020 bear markets well ahead of actual events.
He founded PVT Capital (AFSL No. 546090) in May 2023, which offers investment strategy and advice to wholesale clients.
