Dollar breakout causes gold tremors
By Colin Twiggs
December 15th, 2011 4:00 a.m. ET (8:00 p:m AET)
These extracts from my trading diary are for educational purposes and should not be interpreted as investment or trading advice. Full terms and conditions can be found at Terms of Use.
The Dollar Index broke through resistance at 80.00, signaling a primary advance to 85.00. Rising 63-day Twiggs Momentum indicates a strong up-trend.
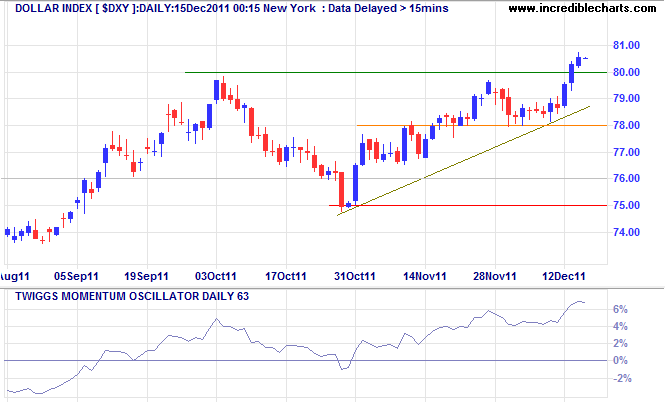
* Target calculations: 80 + ( 80 - 75 ) = 85
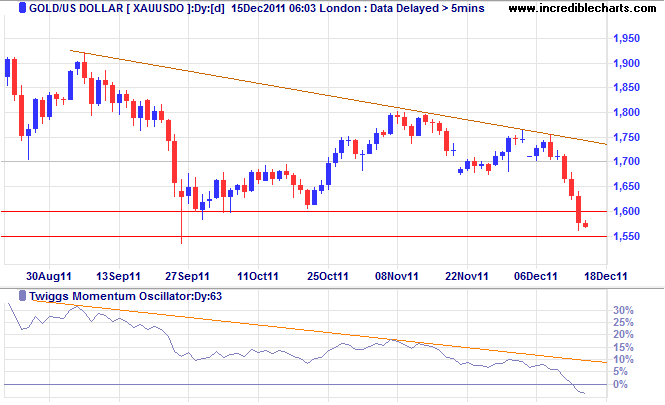
The stronger dollar caused spot gold to weaken, testing the band of support between $1550 and $1600/ounce.
Gold is also testing the lower trend channel on the weekly chart. Cross of 63-day Twiggs Momentum below zero warns of a trend reversal. Failure of support at $1550 would confirm a primary down-trend.
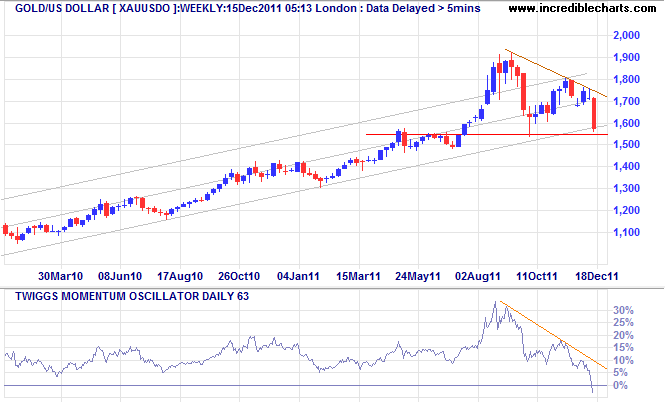
* Target calculation: 1600 - ( 1800 - 1600 ) = 1400
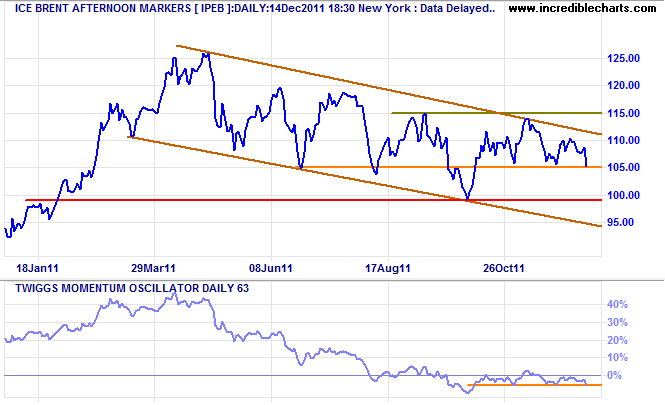
Brent Crude is testing medium-term support at $105/barrel. Failure would indicate a test of the lower trend channel.
CRB Commodities Index is similarly testing support at 292. Breakout would offer a target of 265*.
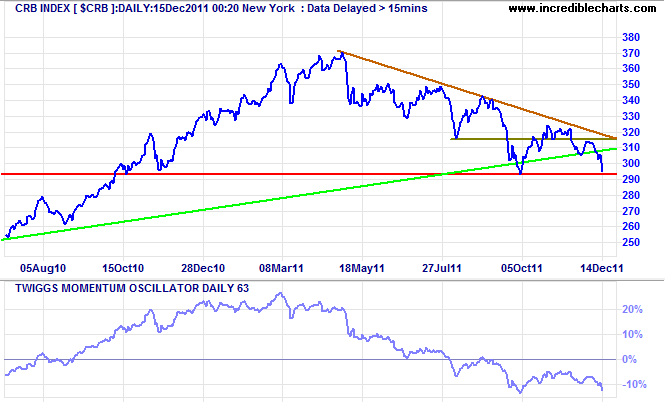
* Target calculation: 295 - ( 325 - 295 ) = 265
Some readers questioned why gold and stocks are falling simultaneously — one normally rises when the other falls. A possible explanation is that expectation of quantitative easing, both from the Fed and ECB, has been supporting both markets. As prospects of QE recede, inflation forecasts will be lowered and demand for inflation-hedge assets (stocks and commodities) will fade. We should see a corresponding rise in bond prices (and falling yields) as a result.
No matter how cynical you get, it's impossible to keep up.
~ Lily Tomlin

Author: Colin Twiggs is a former investment banker with almost 40 years of experience in financial markets. He co-founded Incredible Charts and writes the popular Trading Diary and Patient Investor newsletters.
Using a top-down approach, Colin identifies key macro trends in the global economy before evaluating selected opportunities using a combination of fundamental and technical analysis.
Focusing on interest rates and financial market liquidity as primary drivers of the economic cycle, he warned of the 2008/2009 and 2020 bear markets well ahead of actual events.
He founded PVT Capital (AFSL No. 546090) in May 2023, which offers investment strategy and advice to wholesale clients.
