S&P 500 approaches tipping point
By Colin Twiggs
November 21st, 2011 3:00 a.m. ET (7:00 p.m. AET)
These extracts from my trading diary are for educational purposes and should not be interpreted as investment or trading advice. Full terms and conditions can be found at Terms of Use.
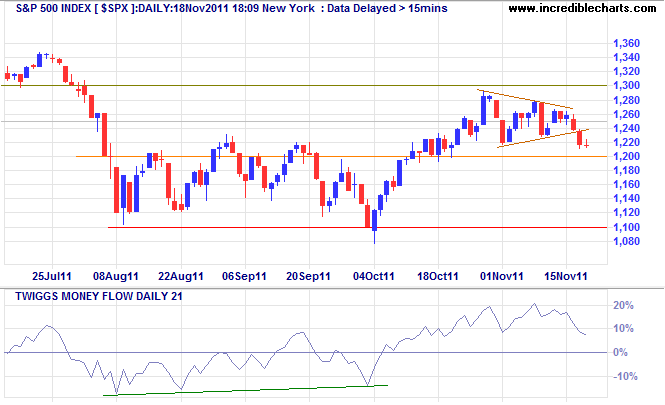
The S&P 500 index broke downwards from its recent pennant, counter to normal bullish expectations, and is testing medium-term support at 1200. Failure of support would test primary support at 1100. Respect of support is less likely, but would suggest a rally to 1300. A 21-day Twiggs Money Flow cross below the zero line would indicate rising selling pressure.
The weekly chart better illustrates the breakout above 1200 followed by several tests of the new support level. Respect of the zero line by 63-day Twiggs Momentum would be a strong bear signal, warning of continuation of the primary down-trend — as would failure of support at 1200.
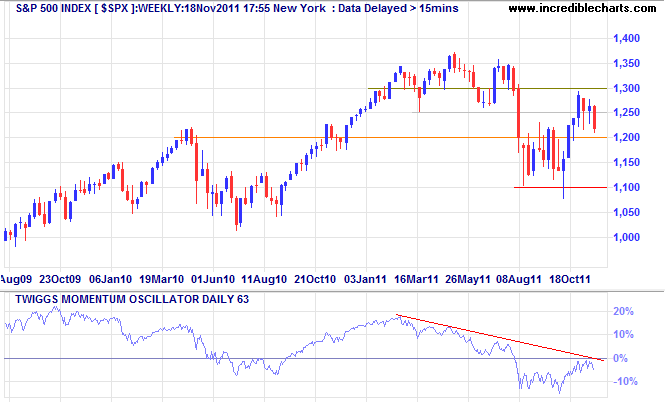
* Target calculation: 1100 - ( 1300 - 1100 ) = 900
Comparing to the 2008 weekly chart, there was a similar break below 1400 in January followed by several months of indecision before a false recovery above 1400 in May. Reversal below 1400 precipitated a major sell-off, with the index falling 50% over the next 9 months. If we look (above) at the current chart, there was a similar fall below 1250, several months of indecision before "recovery" above 1200/1250. Reversal below 1200 would provide a similar bear warning to 2008 — as would a 63-day Twiggs Momentum peak below zero.
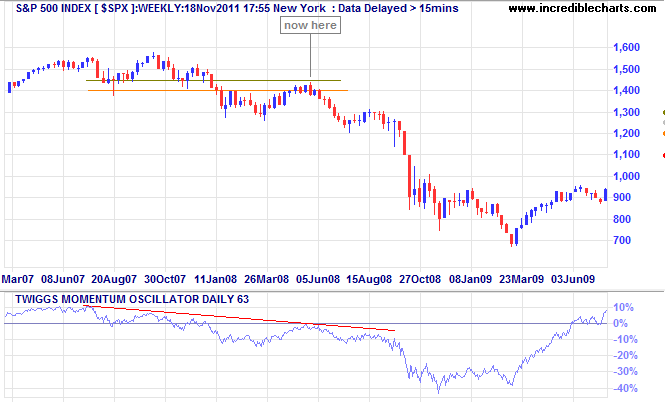
There is no guarantee that stocks will follow the same path as in 2008, but reversal below 1200 would greatly increase the probability of another primary decline — with a target of 900*.
Europe: breach of medium-term support would signal decline
Italy's MIB index is testing medium-term support at 15000 on the weekly chart. Failure — and respect of the descending trendline — would warn of another decline, with a target of 9000*. Breach of primary support at 13000 would confirm.
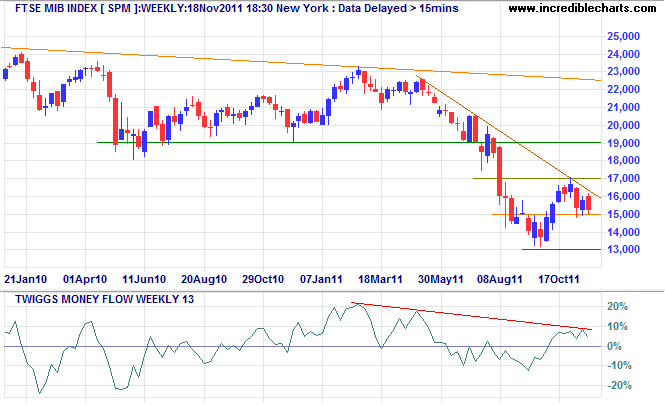
* Target calculation: 13 - ( 17 - 13 ) = 9
France's CAC-40 index is similarly testing support at 3000. Breach of support would warn of another decline — as would reversal of 13-week Twiggs Money Flow below zero. Failure of primary support at 2700 would offer a target of 2000*.
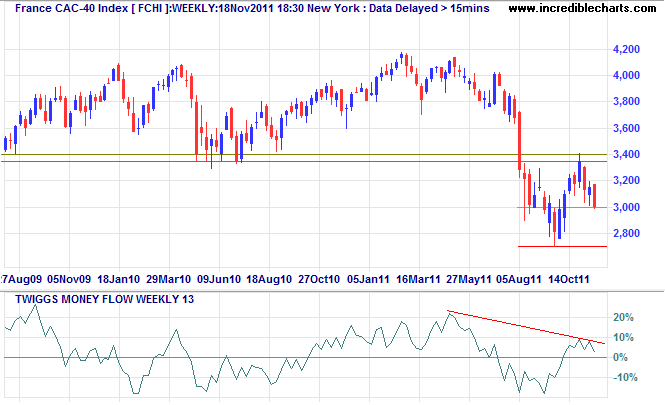
* Target calculation: 2700 - ( 3400 - 2700 ) = 2000
The DAX is also testing medium-term support. Reversal below 5600 would warn of another test of primary support at 5000. Failure of 5000 would offer a target of 3600*.
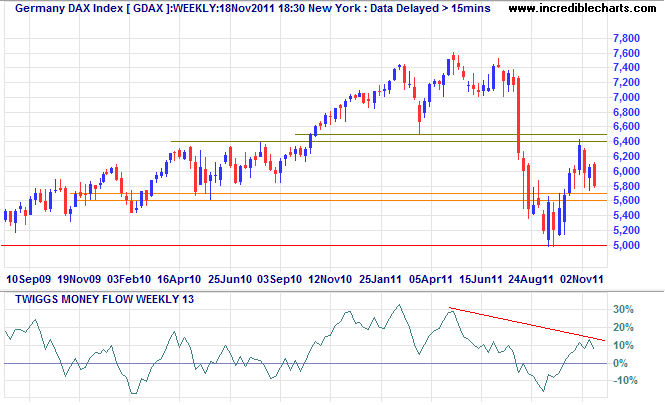
* Target calculation: 5000 - ( 6400 - 5000 ) = 3600
Even the FTSE 100 index is testing medium-term support. 13-Week Twiggs Money Flow looks stronger than its European neighbors, but reversal below zero would warn of a further decline. Breach of medium-term support at 5350 would warn of a test of primary support at 4800.
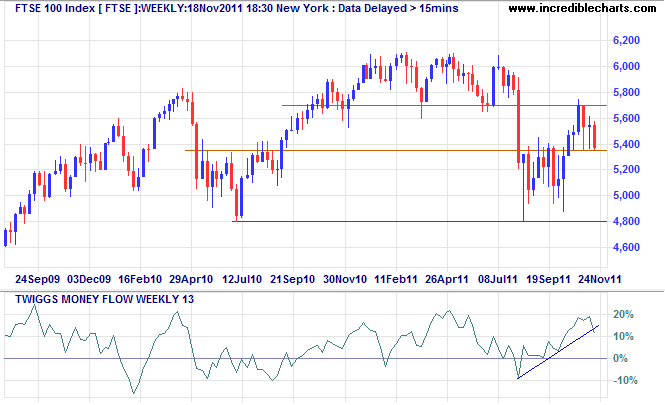
* Target calculation: 4800 - ( 5600 - 4800 ) = 4000
No warning can save people determined to grow suddenly rich.
~ Lord Overstone.

Author: Colin Twiggs is a former investment banker with almost 40 years of experience in financial markets. He co-founded Incredible Charts and writes the popular Trading Diary and Patient Investor newsletters.
Using a top-down approach, Colin identifies key macro trends in the global economy before evaluating selected opportunities using a combination of fundamental and technical analysis.
Focusing on interest rates and financial market liquidity as primary drivers of the economic cycle, he warned of the 2008/2009 and 2020 bear markets well ahead of actual events.
He founded PVT Capital (AFSL No. 546090) in May 2023, which offers investment strategy and advice to wholesale clients.
