Dollar Index: The big picture
By Colin Twiggs
October 20th, 2011 3:00 a.m. ET (6:00 p:m AET)
These extracts from my trading diary are for educational purposes and should not be interpreted as investment or trading advice. Full terms and conditions can be found at Terms of Use.
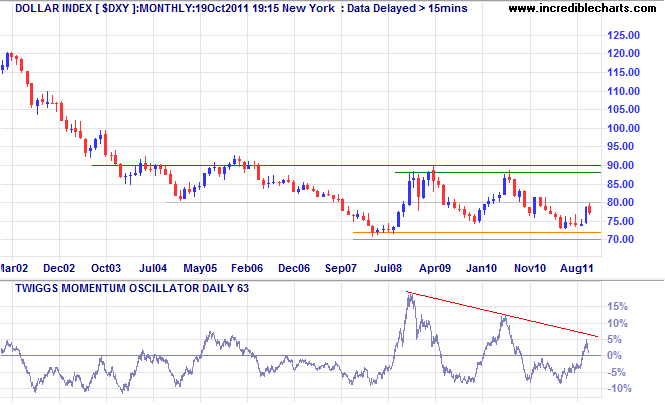
When markets are volatile it often pays to take a step back and look at the big picture. A monthly chart shows the Dollar Index ranging between 70 and 90 since 2003, with the 80 level alternating as mid-range support/resistance. The index recently pulled back from resistance at 80 and will now either re-group for another attempt or medium-term support will give way, signaling a test of long-term support.
Zooming in to the daily chart shows narrow consolidation above medium-term support at 76.50. Breakout above 77.60 and the descending trendline would signal another test of 80, while failure of support at 76 would mean a decline to 73.50*.
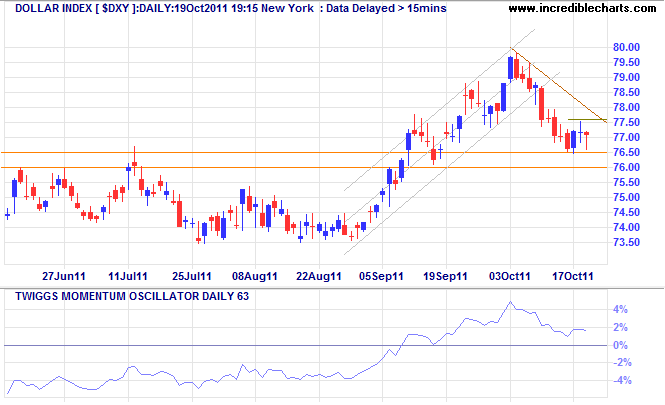
* Target calculation: 76.5 - ( 79.5 - 76.5 ) = 73.5
In the long term, breach of 73.50 would test 70, while breakout above 80 would signal an advance to 90. If support at 70 fails, gold will rocket through $2000/ounce, but that is only likely to occur if the Fed rolls out QE3.
Gold heads for $1600
Spot gold is headed for a test of support at $1600/ounce; failure would offer a target of $1500*. In the long term, the primary trend remains up and breakout above $1700 would signal an advance to $1900.
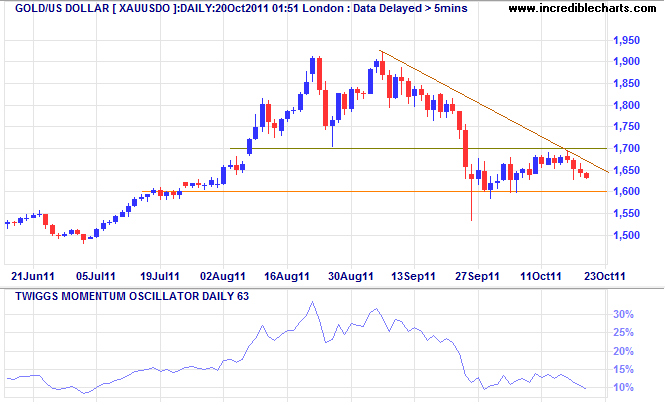
* Target calculation: 1700 - ( 1900 - 1700 ) = 1500
Amex Gold Bugs index ($HUI) is headed for a test of primary support at 500 on the weekly chart. Failure would signal a primary down-trend with an initial target of 400* — and warn of a similar reversal for spot gold. Declining 63-day Twiggs Momentum slipped below zero to strengthen the bear signal.
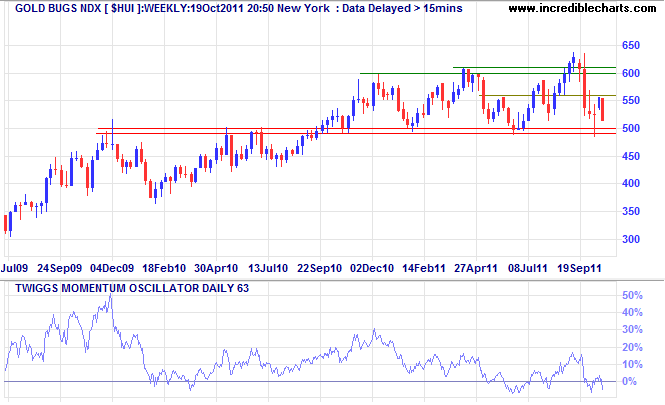
* Target calculation: 500 - ( 600 - 500 ) = 400
Aussie Dollar down-trend
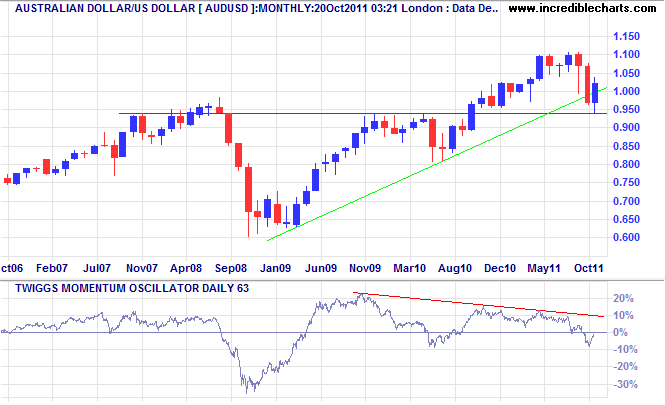
Another monthly chart — this time of the Aussie dollar against the greenback. The decline of the last 3 months found support at $0.94 before rallying to a high of $1.04. Breach of the rising trendline indicates that the primary up-trend has ended; confirmed by bearish divergence on 63-day Twiggs Momentum and reversal below zero. Failure of support at $0.94 would signal a decline to $0.84.
You can transmit knowledge....but not your experience. A man may know what to do and lose money — if he doesn't do it quickly enough.
~ Jesse Livermore in Reminiscences of a Stock Operator by Edwin Lefevre.

Author: Colin Twiggs is a former investment banker with almost 40 years of experience in financial markets. He co-founded Incredible Charts and writes the popular Trading Diary and Patient Investor newsletters.
Using a top-down approach, Colin identifies key macro trends in the global economy before evaluating selected opportunities using a combination of fundamental and technical analysis.
Focusing on interest rates and financial market liquidity as primary drivers of the economic cycle, he warned of the 2008/2009 and 2020 bear markets well ahead of actual events.
He founded PVT Capital (AFSL No. 546090) in May 2023, which offers investment strategy and advice to wholesale clients.
