ASX 200 hits ceiling
By Colin Twiggs
October 18th, 2011 4:00 a.m. ET (7:00 p.m. AET)
These extracts from my trading diary are for educational purposes and should not be interpreted as investment or trading advice. Full terms and conditions can be found at Terms of Use.
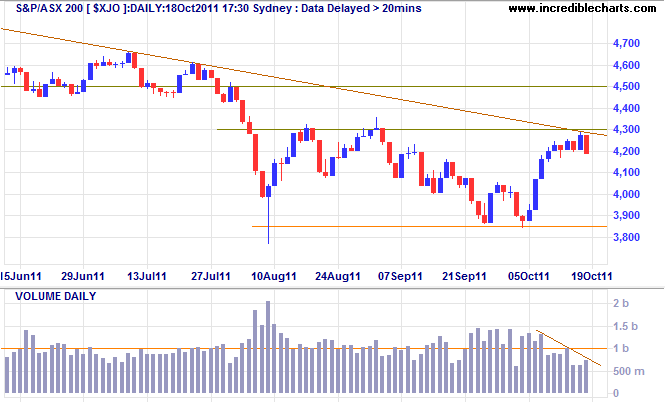
Australia's ASX 200 index encountered both the declining trendline (from April 2011) and resistance at 4300. Low volume indicates a lack of enthusiasm from buyers. The strong red candle warns of another test of 3850; follow-through below Tuesday's low would confirm.

* Target calculation: 4000 - ( 4500 - 4000 ) = 3500
S&P 500 monthly chart
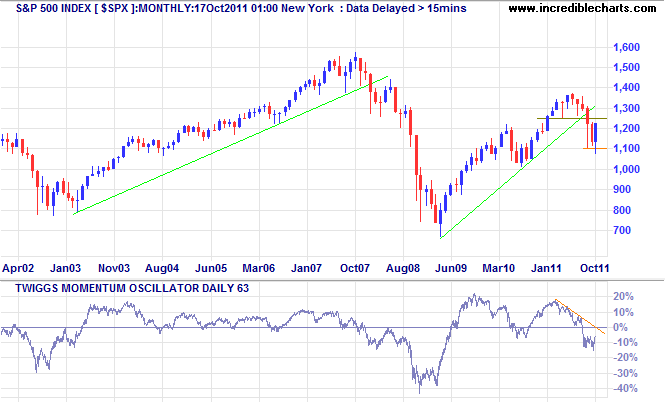
A monthly chart of the S&P 500 index gives a clearer picture. Although the Nasdaq is advancing strongly, the S&P 500 is stuck below its long-term trendline. Note the similarity to March-May 2008 rally. Breakout above 1250 would be a bullish sign, similar to the May 2008 breakout above 1400, but retreat below the former resistance level (1250) would give a strong bear warning. Likewise, a 63-day Twiggs Momentum peak below the zero line would signal a strong primary down-trend.

* Target calculation: 1100 - ( 1250 - 1100 ) = 950
Japan & South Korea buying pressure
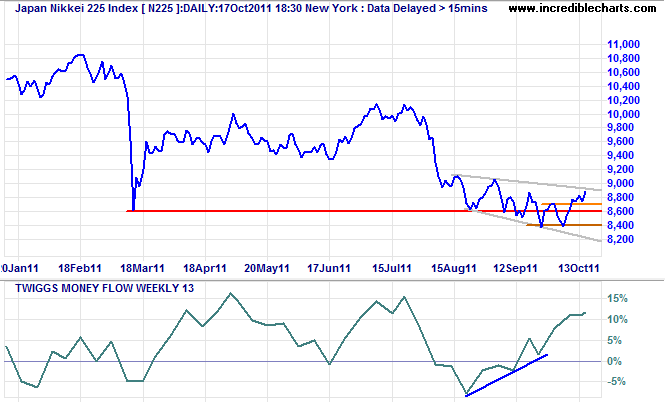
Japan's Nikkei 225 Index retreated Tuesday, but has completed a small double bottom, indicating a test of 9000. Bullish divergence on 13-week Twiggs Money Flow flags strong buying pressure. Breakout above 9000 would indicate an advance to 10000.

* Target calculation: 9000 + ( 9000 - 8400 ) = 9600
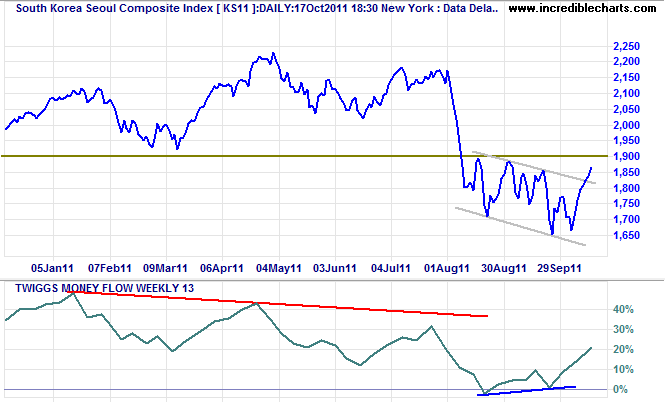
The Seoul Composite Index shows a weaker divergence on 13-week Twiggs Money Flow. Breakout above 1900 would offer a target of 2150, while respect would re-test primary support at 1650.

* Target calculation: 1900 + ( 1900 - 1650 ) = 2150
It is simple arithmetic to prove that it is a wise thing to have the big bet down only when you win, and when you lose to lose only a small exploratory bet, as it were.
~ Jesse Livermore in Reminiscences of a Stock Operator by Edwin Lefevre.

Author: Colin Twiggs is a former investment banker with almost 40 years of experience in financial markets. He co-founded Incredible Charts and writes the popular Trading Diary and Patient Investor newsletters.
Using a top-down approach, Colin identifies key macro trends in the global economy before evaluating selected opportunities using a combination of fundamental and technical analysis.
Focusing on interest rates and financial market liquidity as primary drivers of the economic cycle, he warned of the 2008/2009 and 2020 bear markets well ahead of actual events.
He founded PVT Capital (AFSL No. 546090) in May 2023, which offers investment strategy and advice to wholesale clients.
