US rally encounters resistance
By Colin Twiggs
September 28th, 2011 5:30 a.m. ET (7:30 p.m. AET)
These extracts from my trading diary are for educational purposes and should not be interpreted as investment or trading advice. Full terms and conditions can be found at Terms of Use.
Dow Jones Industrial Average tall shadow (or wick) on the latest candlestick [R] indicates rising selling pressure. With excitement about a European bailout deal fading, expect a test of support at 10600. Failure would indicate another down-swing, with a target of 10000*.
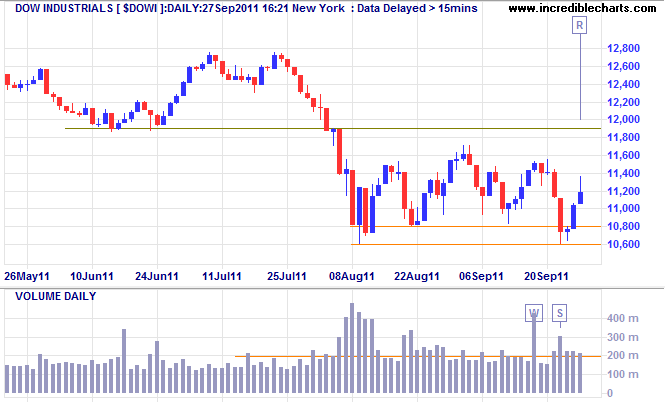
* Target calculation: 11000 - ( 12000 - 11000 ) = 10000
S&P 500 Index shows continued consolidation between 1120 and 1220 on the weekly chart. 13-Week Twiggs Money Flow below zero indicates selling pressure. Failure of support at 1120 would test the 2010 low at 1020*/1000.
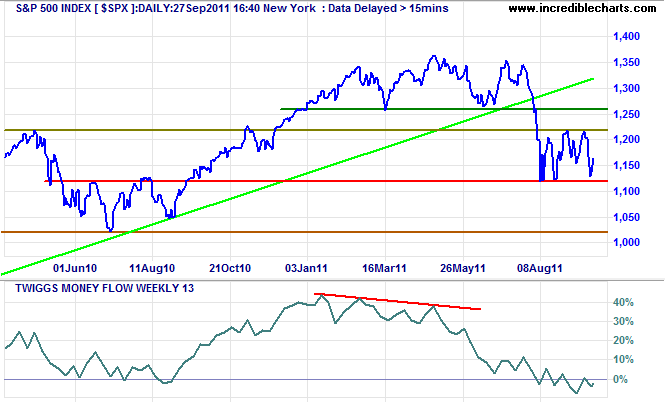
* Target calculation: 1120 - ( 1220 - 1120 ) = 1020
NASDAQ 100 Index shows an evening star reversal warning, completed if price reverses below 2200. 63-Day Twiggs Momentum holding below zero reminds that we are in a primary down-trend. Breach of the lower trend channel would warn of another down-swing, with a target of 1750*.
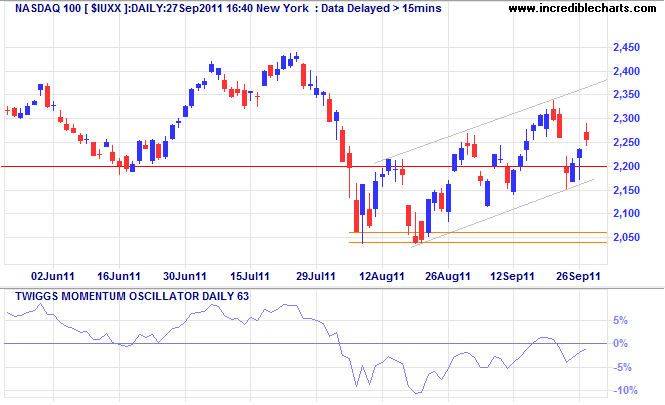
* Target calculation: 2050 - ( 2350 - 2050 ) = 1750
China, Hong Kong continue down-trend
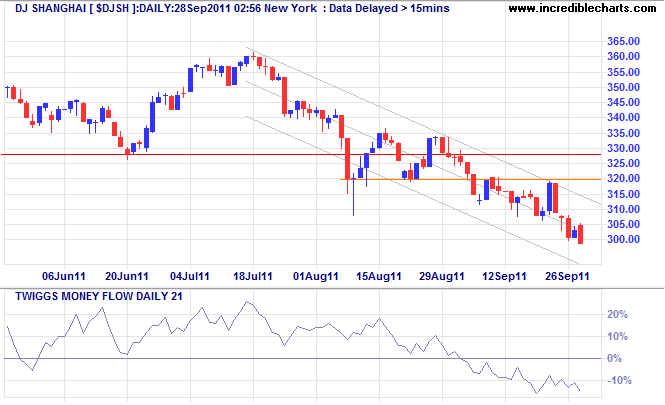
Dow Jones Shanghai Index continued a down-swing Wednesday to test the lower border of its downward trend channel. 21-Day Twiggs Money Flow declining below zero warns of strong selling pressure.
The Shanghai Composite index is headed for support at its target of 2350. 63-Day Twiggs Momentum declining below zero reminds that we are in a primary down-trend. Expect some retracement or consolidation at support. Failure would warn of a decline to 2000*.
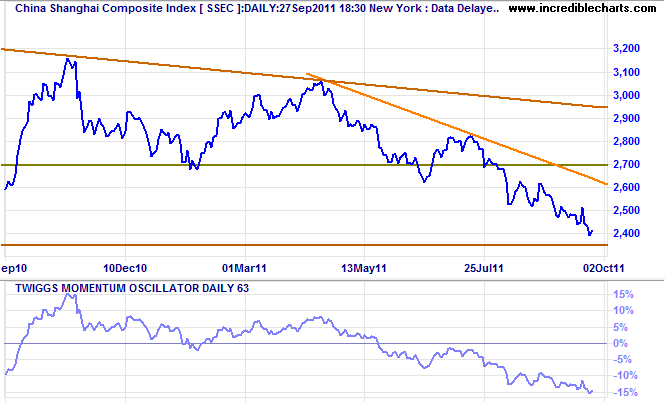
* Target calculation: 2350 - ( 2700 - 2350 ) = 2000
Hang Seng Index found resistance at 18000 on Wednesday after rallying earlier in the week. The primary trend is down and 13-week Twiggs Money Flow (below zero) warns of selling pressure. Resistance at 19000 is expected to hold, followed by down-swing to 16000*.
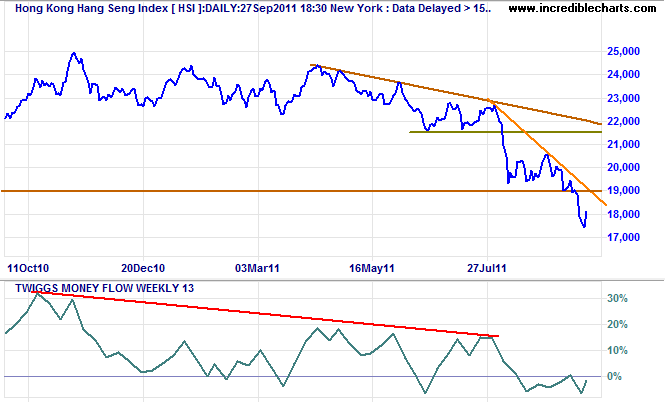
* Target calculation: 17500 - ( 19000 - 17500 ) = 16000
Japan & South Korea
Bullish divergence on Japan�s Nikkei 225 index (13-week Twiggs Money Flow) warns of a bear market rally. Breakout above the upper channel of the broadening wedge pattern would confirm. The primary trend, however, remains downward; breakout below the lower channel at 8400 would warn of a down-swing to 7800*.
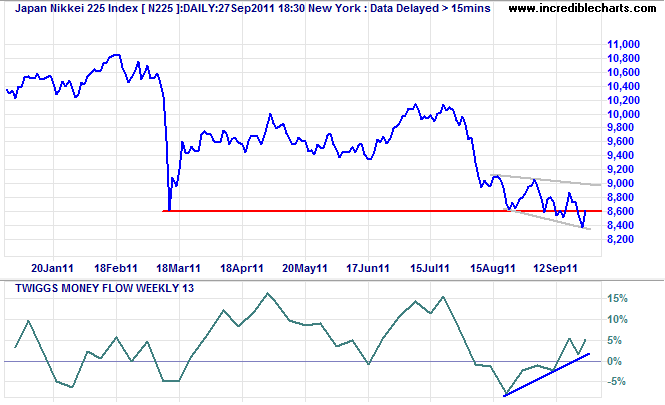
* Target calculation: 8400 - ( 9000 - 8400 ) = 7800
The Seoul Composite is weaker on Wednesday after a sharp rally earlier in the week. 13-Week Twiggs Money Flow continues to threaten a break below zero. Breakout below the lower border of the broadening wedge formation would signal another primary decline.
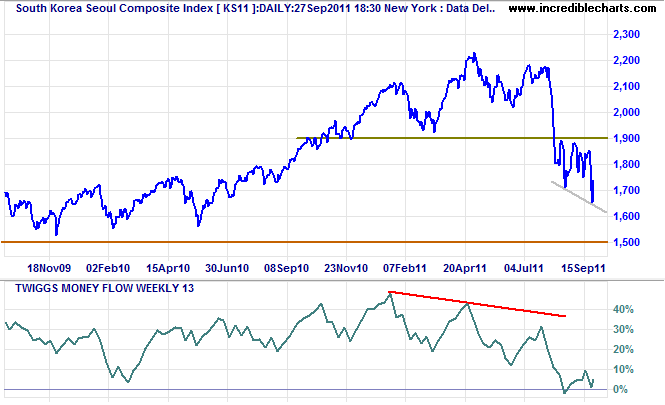
* Target calculation: 1650 - ( 1900 - 1650 ) = 1400
The public, with their eyes fixed on the stock market, saw little – that week. The wise stock operators saw much – that year. That was the difference.
~ Jesse Livermore in Reminiscences of a Stock Operator by Edwin Lefevre.

Author: Colin Twiggs is a former investment banker with almost 40 years of experience in financial markets. He co-founded Incredible Charts and writes the popular Trading Diary and Patient Investor newsletters.
Using a top-down approach, Colin identifies key macro trends in the global economy before evaluating selected opportunities using a combination of fundamental and technical analysis.
Focusing on interest rates and financial market liquidity as primary drivers of the economic cycle, he warned of the 2008/2009 and 2020 bear markets well ahead of actual events.
He founded PVT Capital (AFSL No. 546090) in May 2023, which offers investment strategy and advice to wholesale clients.
