Weak Asian markets warn of continued selling pressure
By Colin Twiggs
September 19th, 2011 7:30 a.m. ET (9:30 p.m. AET)
These extracts from my trading diary are for educational purposes and should not be interpreted as investment or trading advice. Full terms and conditions can be found at Terms of Use.
Dow Jones Japan Index is testing long-term support at 50.00. 13-Week Twiggs Money Flow oscillating around zero indicates uncertainty; reversal below zero would warn of rising selling pressure. Breakout below 4800 would offer a target of 35.00*.
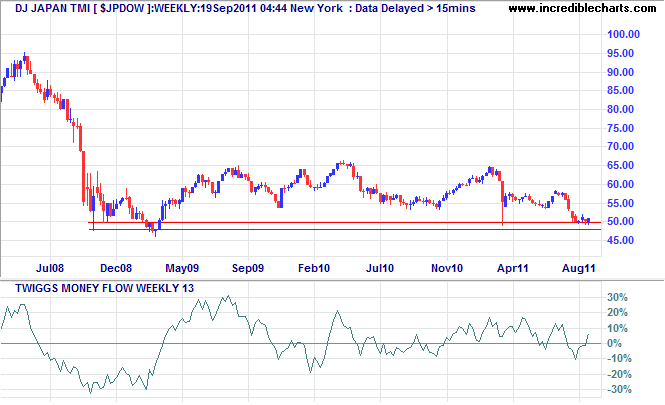
* Target calculation: 50 - ( 65 - 50 ) = 35
The Nikkei 225 Index is headed for a test of 7000* after breaking support at 9000 on the weekly chart.
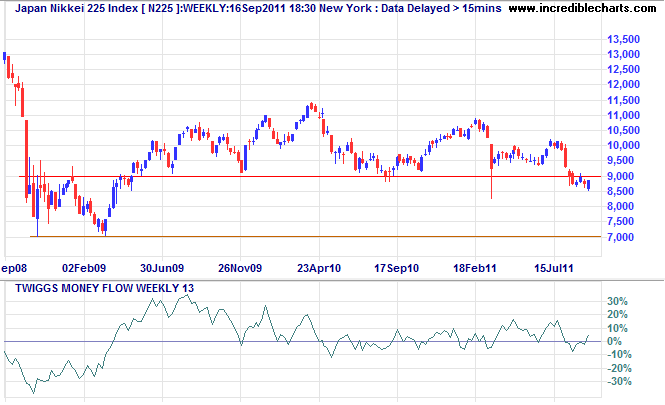
* Target calculation: 9000 - ( 11000 - 9000 ) = 7000
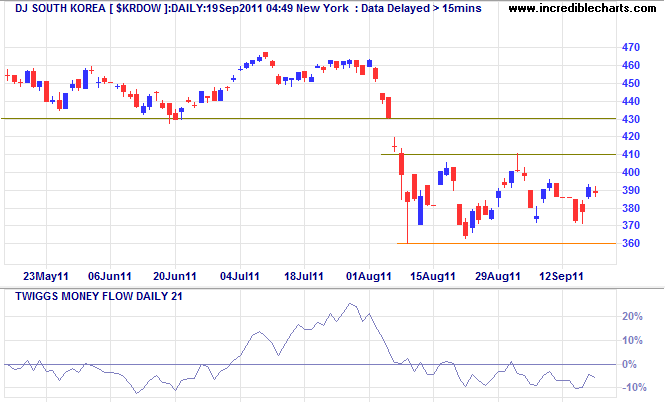
Dow Jones South Korea Index is consolidating between 360 and 410 on the daily chart. 21-Day Twiggs Money Flow below zero warns of strong medium-term selling pressure. Downward breakout would offer a target of 290*.
* Target calculation: 9000 - ( 11000 - 9000 ) = 7000
HongKong sell-off accelerates
Dow Jones HongKong Index reversed below 400, warning of another down-swing. The secondary trendline and declining 63-day Momentum indicate that the sell-off is accelerating.
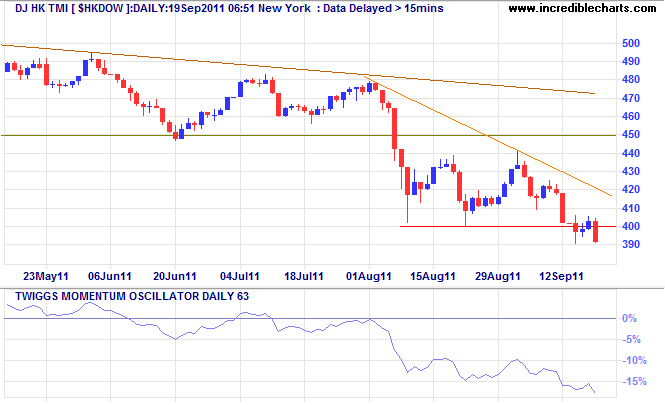
* Target calculation: 400 - ( 450 - 400 ) = 350
Weekly chart of the Shanghai Composite Index shows a primary down-swing to test support at 2300*. Reversal of 13-week Twiggs Money Flow below zero would warn of rising selling pressure. Failure of support would test the 2008 low of 1700.
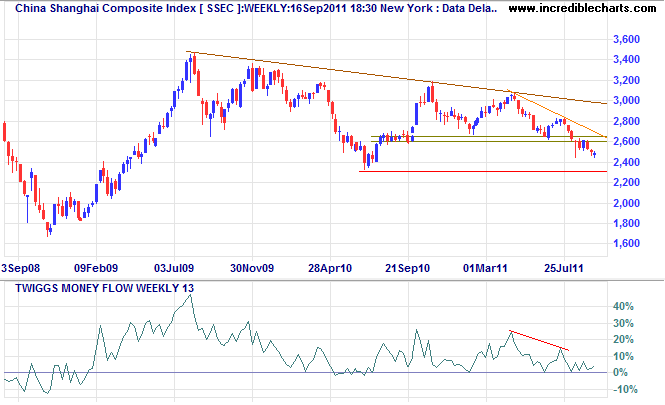
* Target calculation: 2650 - ( 3000 - 2650 ) = 2300
The sell-off in Asian markets will impact on others with a strong mining sector: Australia, Brazil, South Africa and Canada.
DAX key reversal; FTSE rally fades
Germany's DAX Index shows a strong key reversal [R] on the weekly chart. Expect a rally, but we are in a bear market and resistance at 6500 is likely to hold. Reversal below 5400 would warn of another down-swing.
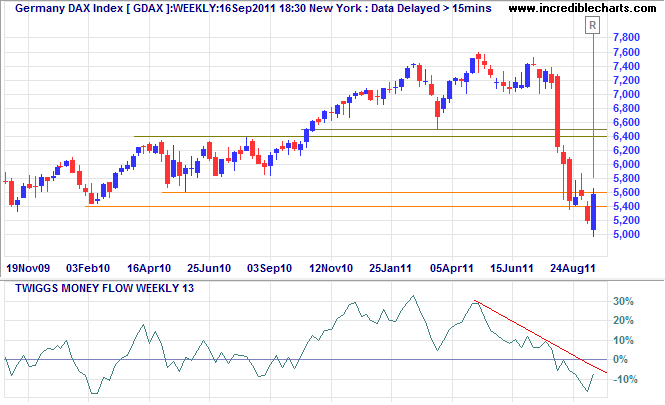
* Target calculation: 5500 - ( 6500 - 5500 ) = 4500
The FTSE 100 fell at Monday's open, but the weekly chart displays a particularly volatile consolidation edging higher. Breakout above 5400 would indicate a test of 5600/5700. Again, we are in a bear market; respect of resistance is likely and would warn of another test of 4800.
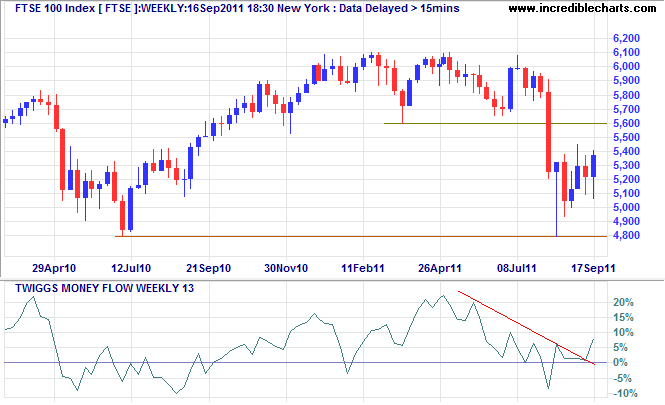
* Target calculation: 5000 - ( 5600 - 5000 ) = 4400
The big money is made by the sittin' and the waitin' — not the thinking. Wait until all the factors are in your favor before making the trade.
~ Jesse Livermore in Reminiscences of a Stock Operator by Edwin Lefevre.

Author: Colin Twiggs is a former investment banker with almost 40 years of experience in financial markets. He co-founded Incredible Charts and writes the popular Trading Diary and Patient Investor newsletters.
Using a top-down approach, Colin identifies key macro trends in the global economy before evaluating selected opportunities using a combination of fundamental and technical analysis.
Focusing on interest rates and financial market liquidity as primary drivers of the economic cycle, he warned of the 2008/2009 and 2020 bear markets well ahead of actual events.
He founded PVT Capital (AFSL No. 546090) in May 2023, which offers investment strategy and advice to wholesale clients.
