10-Year Treasury yields at new 50-year low
By Colin Twiggs
August 22nd, 2011 6:30 p.m. ET (8:30 p.m. AET)
These extracts from my trading diary are for educational purposes and should not be interpreted as investment or trading advice. Full terms and conditions can be found at Terms of Use.
New Format
I post fresh analysis to the Gold, Stocks & Forex trading blog every day. Existing Trading Diary summaries will continue, but readers can also elect to receive every post or daily/weekly updates.
Thank you for your support and I hope you enjoy the new format.
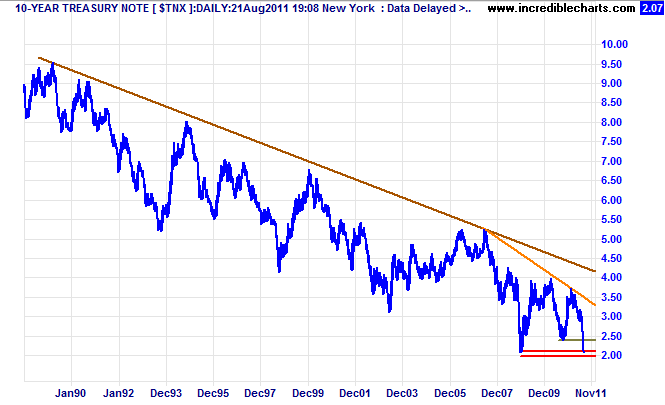
10-Year Treasury yields at new 50-year low
10-Year Treasury yields are testing support at 2.00 percent — a 50-year low. One thing is clear: Fed monetary policy has failed. Suppressing short-term interest rates has, in most cases, lifted the economy out of recession, but also set us up for an even bigger crash the next time round — requiring even more severe interest rate cuts. Long-term yields have been falling for 30 years. We are now clipping the tree tops — with short-term rates near zero and no gas in the tank to lift us over the next obstacle. A bond market revolt cannot be far off.
European crash
Germany's DAX Index is testing support at its 2010 low of 5400. 13-Week Twiggs Money Flow below zero warns of further selling pressure. Failure of support would offer a target of 4500*.
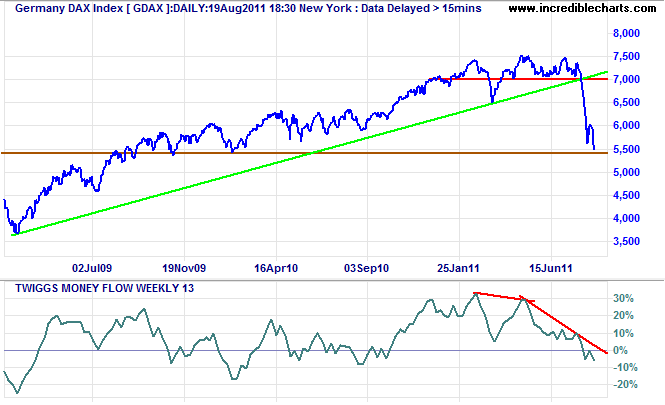
* Target calculation: 5500 - ( 6500 - 5500 ) = 4500
France has fallen well past its 2010 low, testing support at 3000. 13-Week Twiggs Money Flow again warns of selling pressure. Breach of 3000 would test the 2009 low of 2500.
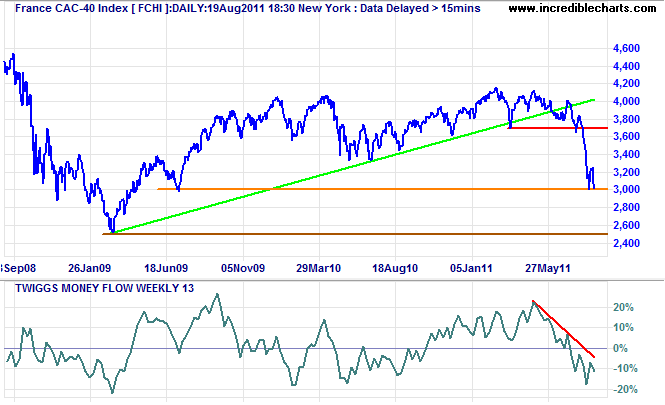
* Target calculation: 3000 - ( 3700 - 3000 ) = 2300
Secondary markets are as badly affected. The Amsterdam AEX Index fell below its 2010 low, while 13-week Twiggs Money Flow below zero warns of selling pressure.
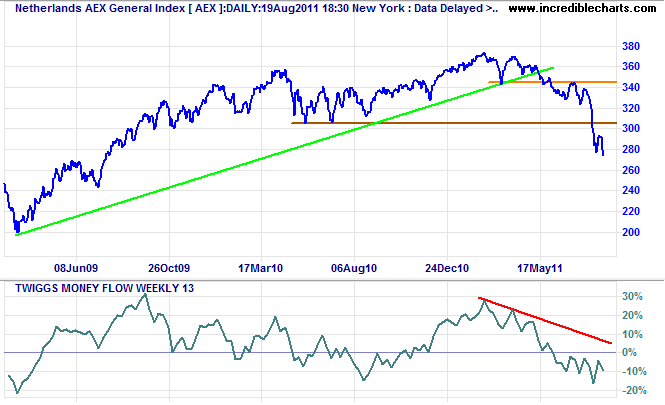
* Target calculation: 300 - ( 340 - 300 ) = 260
Nasdaq breaks support
The Nasdaq 100 broke support at 2050, warning of a down-swing to 1900*. Follow-through below last week's low of 2040 would confirm. The latest peak on 21-day Twiggs Money Flow, barely breaking the zero line, indicates strong medium-term selling pressure.
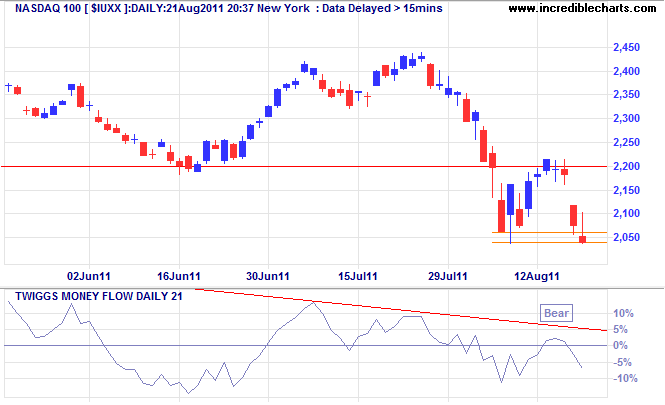
* Target calculation: 2050 - ( 2200 - 2050 ) = 1900
The Dow is headed for a similar test: follow-through below 10600 would confirm a down-swing to 9600*. Higher volumes indicate the presence of buyers and failure of support would prove seller's dominance.
China commits to down-trend
The Dow Jones Shanghai Index reversed below primary support at 328, confirming the primary down-trend signal from the Shanghai Composite Index. The 21-day Momentum peak barely above zero strengthens the bear signal.
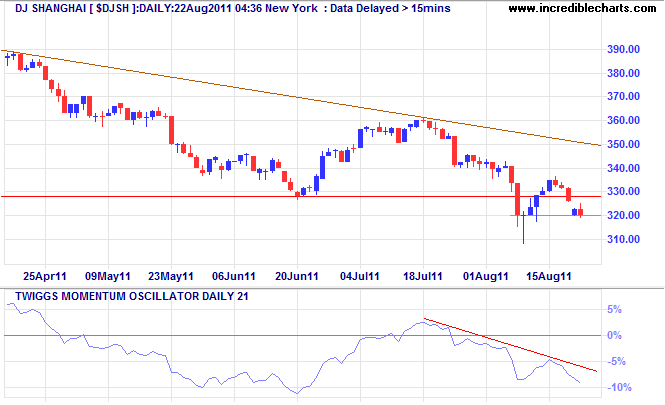
* Target calculation: 330 - ( 360 - 330 ) = 300
A market does not culminate in one grand blaze of glory. Neither does it end with a sudden reversal of form. A market can and often does cease to be a bull market long before prices generally begin to break..... one after another those stocks which had been leaders of the market reacted several points from the top and — for the first time in many months — did not come back. Their race was evidently run...
~ Jesse Livermore in Reminiscences of a Stock Operator by Edwin Lefevre.

Author: Colin Twiggs is a former investment banker with almost 40 years of experience in financial markets. He co-founded Incredible Charts and writes the popular Trading Diary and Patient Investor newsletters.
Using a top-down approach, Colin identifies key macro trends in the global economy before evaluating selected opportunities using a combination of fundamental and technical analysis.
Focusing on interest rates and financial market liquidity as primary drivers of the economic cycle, he warned of the 2008/2009 and 2020 bear markets well ahead of actual events.
He founded PVT Capital (AFSL No. 546090) in May 2023, which offers investment strategy and advice to wholesale clients.
