Early stages of denial
By Colin Twiggs
August 15th, 2011 7:00 a.m. ET (9:00 p.m. AET)
These extracts from my trading diary are for educational purposes and should not be interpreted as investment or trading advice. Full terms and conditions can be found at Terms of Use.
New Format
I will post fresh analysis to the Gold, Stocks & Forex trading blog every day. Posts of no more than a few paragraphs are easier to digest and the Comments section on each page will hopefully encourage greater interaction with readers. The existing Trading Diary summaries will continue, but readers can also elect to receive every post or daily/weekly updates.
Thank you for your support and I hope you enjoy the new format.
US dead cat bounce
We have a clear bear market signal across a wide range of indexes and current behavior is typical of the early "Denial" stage. If we look at 2008, the Dow broke primary support at 12800 in January, falling sharply before encountering strong buying support at 12000, signaled by weekly volume over 1.5 billion [1]. The rally failed, but buyers again snapped up bargains, with weekly volumes [2] above 1.5 billion. A third rally even penetrated resistance, but buyers soon lost interest and the next down-swing [3] led to a strong bear market over the next year.
Current buying support, with weekly volume close to 2 billion [4] is typical of the first stage of a bear market . Expect a rally to test 12000 followed by another test of support between 10600 and 10800.
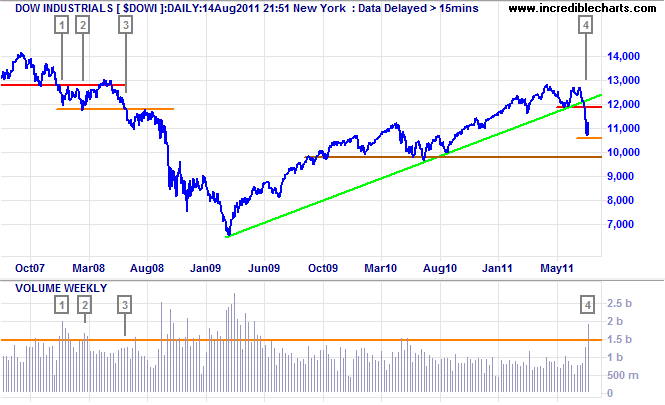
* Target calculation: 10800 - (11800 - 10800 ) = 9800
Japan, Korea hesitate
The Dow Jones Japan Index ($JPDOW) formed a small pennant consolidation, favoring continuation of the down-trend. Follow-through below 50.50 would confirm, whereas recovery above 52.00 would indicate retracement to test 53.30. 21-Day Twiggs Money Flow deep below zero warns of strong selling pressure.
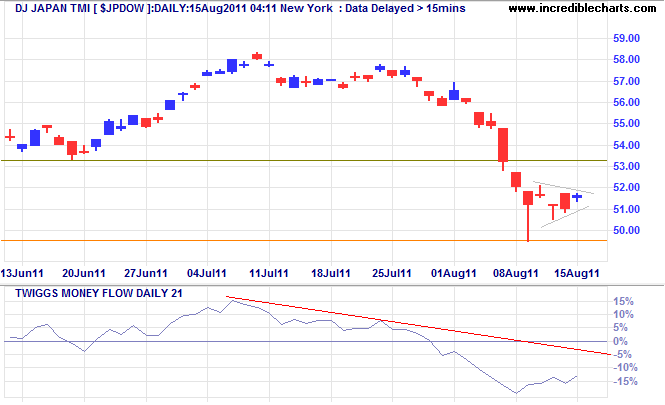
* Target calculation: 54 - ( 58 - 54 ) = 50
DJ South Korea encountered resistance below 400, indicated by a red candle and up-tick in volume. Reversal below 360 would warn of another down-swing.
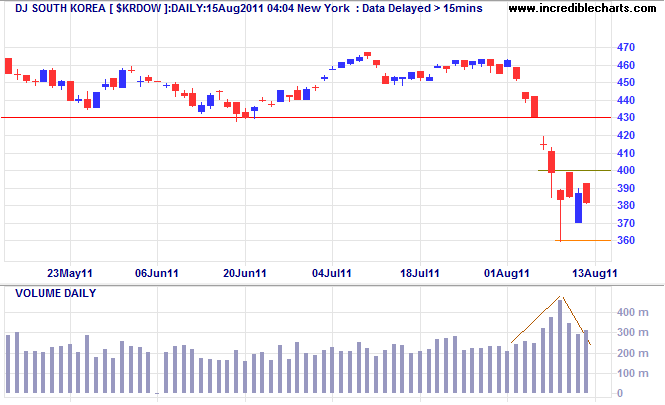
* Target calculation: 370 - ( 430 - 370 ) = 310
China bucks the trend
Despite the global bear market, Dow Jones Shanghai Index rallied above resistance at 330, with bullish divergence on 21-day Twiggs Money Flow indicating buying pressure. Expect a test of 360. In the long term, breakout above 360 would signal reversal to an up-trend.
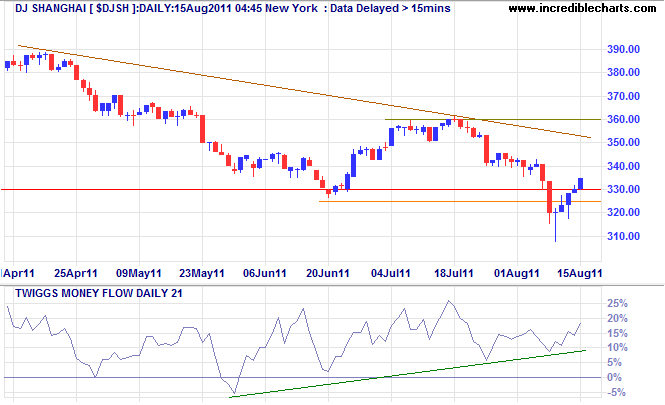
* Target calculation: 330 - ( 360 - 330 ) = 300
ASX Trampled
The ASX 200 is headed for a test of 4500. Declining volume is typical of such a rally; a surge would indicate increased selling pressure — especially when accompanied by a narrow range or red candle. Expect resistance at 4500 to hold, followed by another test of support at 4000.
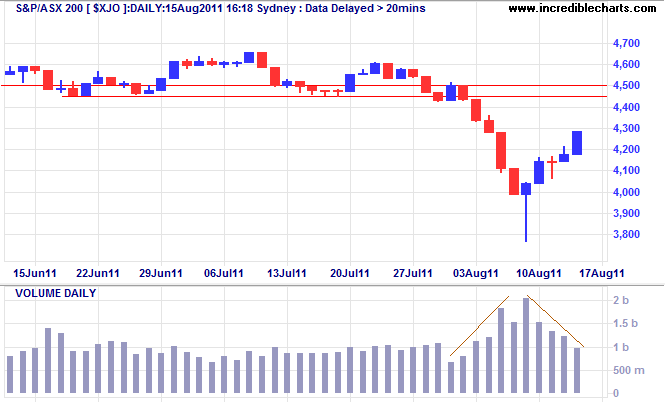
* Target calculation: 4000 - ( 4500 - 4000 ) = 3500
I came to learn that even when one is properly bearish at the very beginning of a bear market it is not well to begin selling in bulk until there is no danger of the engine back-firing.
~ Jesse Livermore in Reminiscences of a Stock Operator by Edwin Lefevre.

Author: Colin Twiggs is a former investment banker with almost 40 years of experience in financial markets. He co-founded Incredible Charts and writes the popular Trading Diary and Patient Investor newsletters.
Using a top-down approach, Colin identifies key macro trends in the global economy before evaluating selected opportunities using a combination of fundamental and technical analysis.
Focusing on interest rates and financial market liquidity as primary drivers of the economic cycle, he warned of the 2008/2009 and 2020 bear markets well ahead of actual events.
He founded PVT Capital (AFSL No. 546090) in May 2023, which offers investment strategy and advice to wholesale clients.
