The show isn't over
By Colin Twiggs
July 12th, 2011 7:00 a.m. ET (9:00 p.m. AET)
These extracts from my trading diary are for educational purposes and should not be interpreted as investment or trading advice. Full terms and conditions can be found at Terms of Use.
The show isn't over until the fat lady sings. Now that quarter-end window-dressing is over, markets with few exceptions show strong selling pressure and are likely to re-test primary support levels — or commence a primary down-trend.
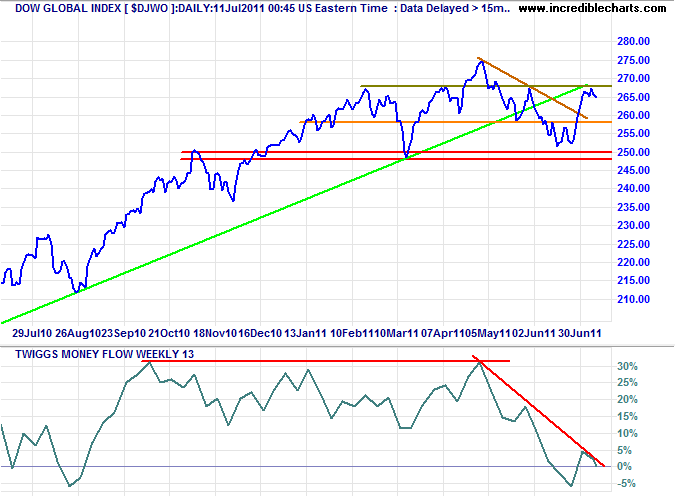
Global Index
The Dow Jones Global Index is testing resistance at 268, but declining 13-week Twiggs Money Flow warns of strong selling pressure. Failure of medium-term support at 258 would test primary support at 250. And failure of 250 would signal a primary down-trend.
USA
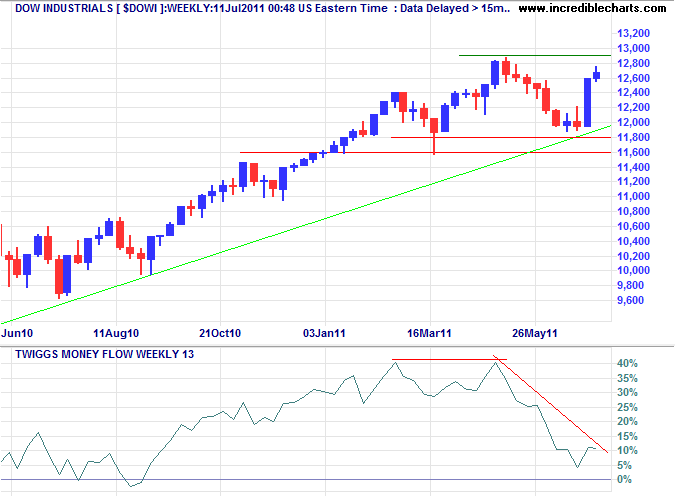
Dow Jones Industrial Average
The Dow is headed for resistance at 12900 on the weekly chart, but the sharp fall on 13-week Twiggs Money Flow warns of selling pressure. Expect another test of primary support at 11800.
S&P 500
The S&P 500 is testing the April high at 1370, but a sharp fall on 13-week Twiggs Money Flow warns of another test of primary support. Breach of 1250 would signal a reversal.
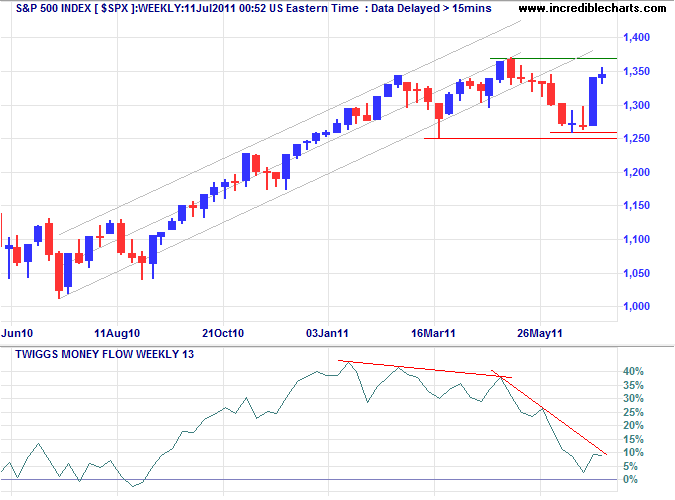
* Target calculation: 1370 + ( 1370 - 1260 ) = 1480 or 1260 - ( 1370 - 1260 ) = 1150
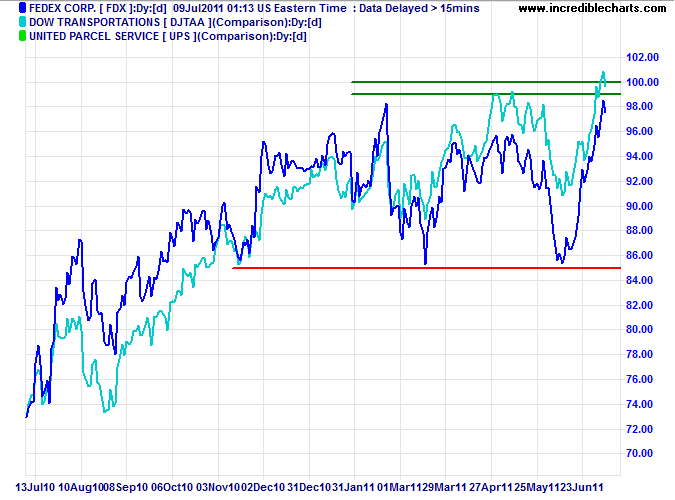
Transport
Bellwether transport stock Fedex is testing resistance between $99 and $100; breakout would signal a fresh advance. The Dow Transport Average is similarly testing resistance at its April high. Resumption of the primary up-trend would be a positive sign for the broader economy. But frothy results from Fedex last week were attributable to the falling dollar, while activity levels remained stagnant.
Technology
The Nasdaq 100 is testing resistance at 2400/2420 on the weekly chart. Breakout would signal a fresh advance, but bearish divergence on 13-week Twiggs Money Flow warns of a reversal. Breach of support at 2200 would signal a primary down-trend.
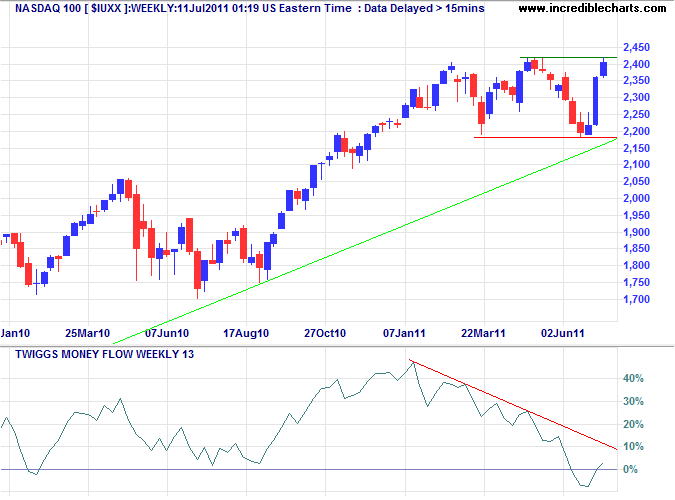
* Target calculation: 2200 - ( 2400 - 2200 ) = 2000 or 2400 + ( 2400 - 2200 ) = 2600
Canada: TSX
The TSX Composite Index continues to signal selling pressure on 13-week Twiggs Money Flow after a large bearish divergence; a fall below zero would strengthen the signal. Reversal below 13200 would indicate another down-swing.
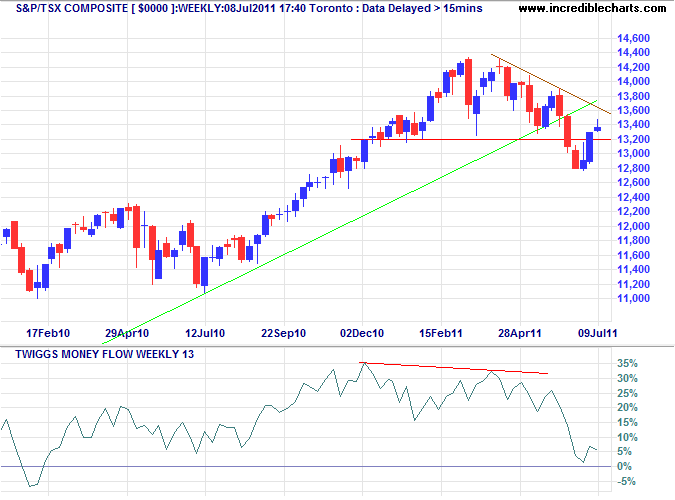
* Target calculation: 13500 - ( 14200 - 13500 ) = 12800
United Kingdom
The FTSE 100 displays a tall shadow on the latest weekly candle and, together with bearish divergence on 13-week Twiggs Money Flow, indicates strong selling pressure. Breach of support, around 5650, would signal reversal to a primary down-trend. Breakout above 6100 is unlikely, but would offer a target of 6500*.
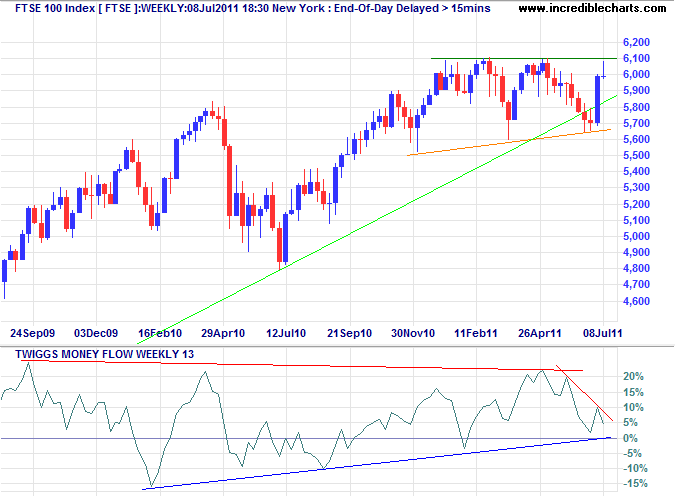
* Target calculation: 6100 + ( 6100 - 5700 ) = 6500 or 5600 - ( 6100 - 5600 ) = 5100
Germany
The DAX also displays a bearish weekly candle at resistance of 7500, while bearish divergence on 13-week Twiggs Money Flow warns of strong selling pressure. Failure of support at 7000 would signal a primary down-trend. Breakout above 7600 is unlikely, but would offer a target of 8000*.
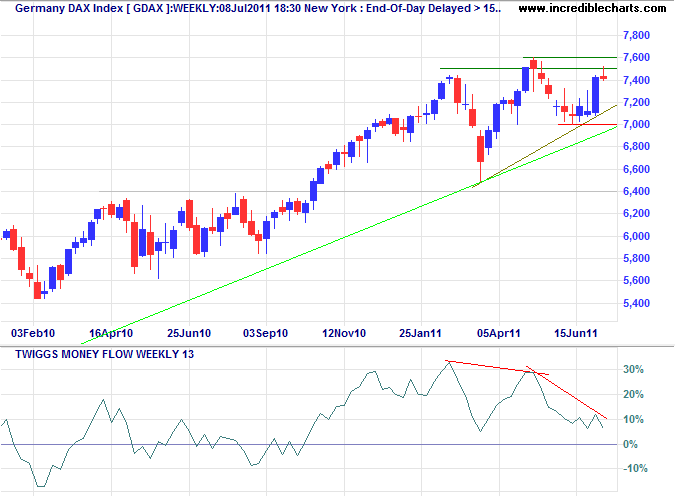
* Target calculation: 7500 + ( 7500 - 7000 ) = 8000
France
The CAC-40 likewise warns of strong selling pressure, with 13-week Twiggs Money Flow crossing below zero. Breach of support at 3700 would confirm a primary reversal.
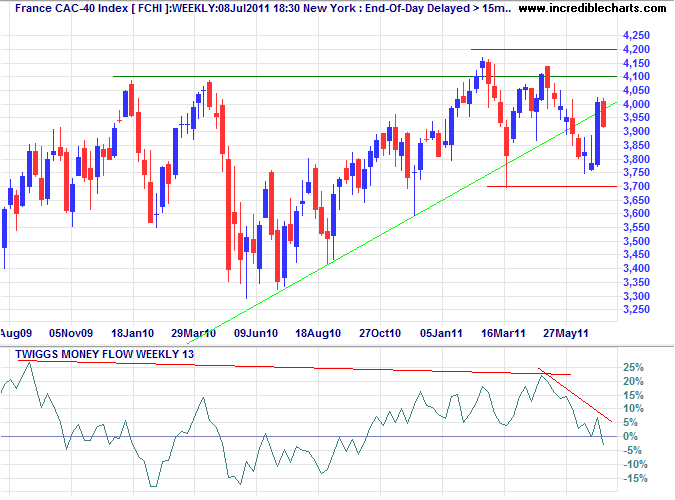
* Target calculation: 4100 + ( 4100 - 3800 ) = 4400
India
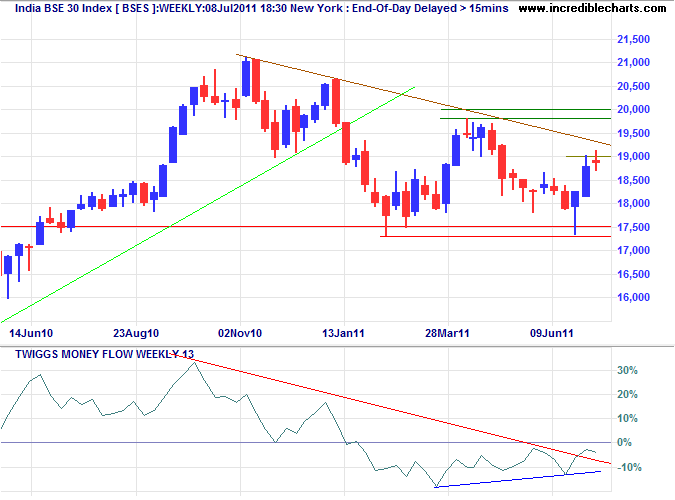
The Sensex weakened to 18700 Monday, while 13-week Twiggs Money Flow holding below zero indicates strong selling pressure. Expect another test of primary support at 17500.
Singapore
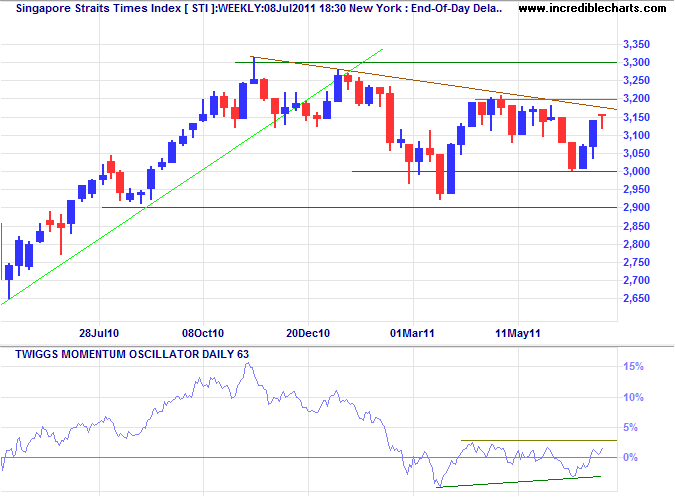
The Straits Times Index fell to 3120 Monday, but is one of the few markets reflecting some positive (albeit medium-term) sentiment. Breakout of 63-day Momentum above 3% would suggest the start of an up-trend. And breach of resistance at 3200 would confirm. Reversal below 3100 is as likely, however, and would warn of another test of primary support at 3000.
Japan
The Nikkei 225 is retracing to test its new support level Monday, after a breakout above 10000 on the weekly chart. Respect of 10000 would confirm an advance to 10700*. Rising 13-week Twiggs Money Flow indicates buying pressure.
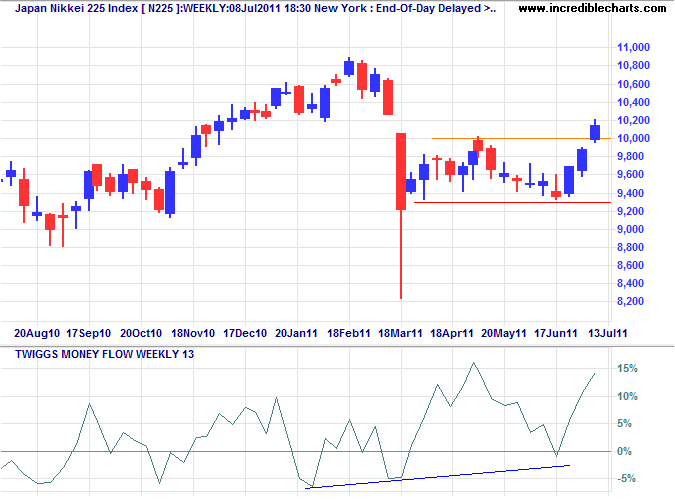
* Target calculation: 10000 + ( 10000 - 9300 ) = 10700
South Korea
The Seoul Composite Index retraced to 2155 Monday. Respect of resistance at 2200 would signal another test of primary support at 2000. Bearish divergence on 13-week Twiggs Money Flow warns of selling pressure.
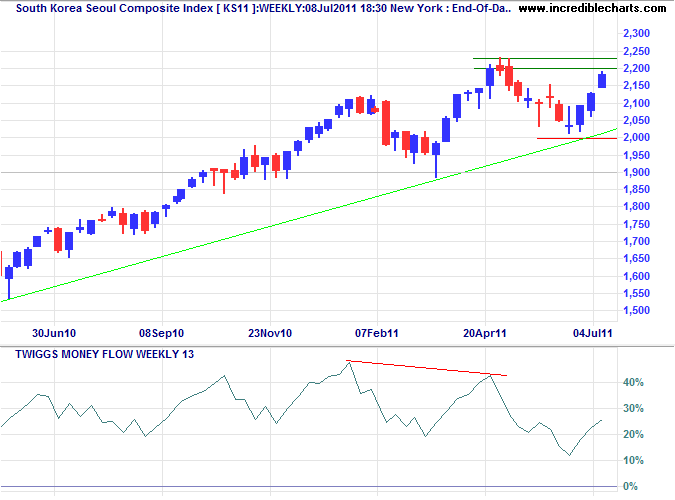
* Target calculation: 2200 + ( 2200 - 2000 ) = 2400
Taiwan
The Dow Jones Taiwan Index displays strong selling pressure on 13-week Twiggs Money Flow, with a sharp fall after earlier bearish divergence. Expect another test of medium-term support at 200. Primary support remains at 196.
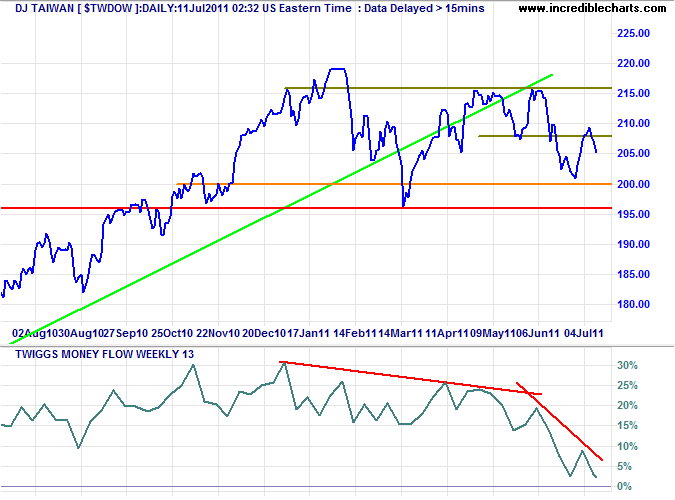
* Target calculation: 220 + ( 220 - 195 ) = 245
China
The Shanghai Composite Index consolidated at 2800 Monday, above primary support at 2600/2700. Bearish divergence on 13-week Twiggs Money Flow continues to warn of long-term selling pressure.
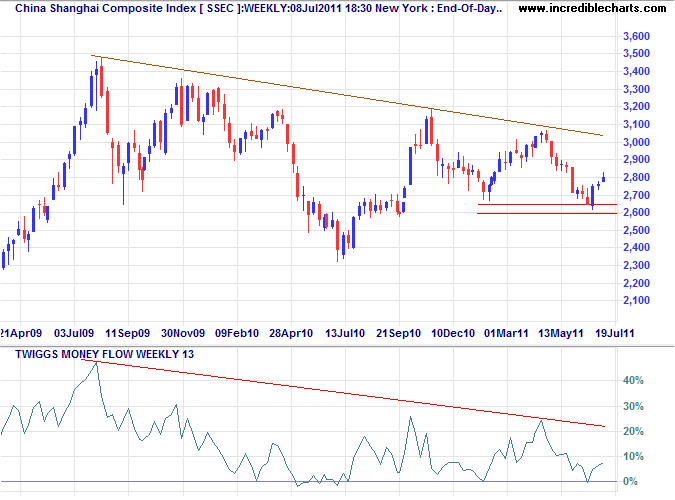
* Target calculations: 2700 - ( 3050 - 2700 ) = 2350
The Hang Seng Index retreated on Monday, headed for another test of primary support at 22200. The sharp fall on 21-day Twiggs Money Flow reflects the sale by Temasek of part of its stake in China Construction Bank and Bank of China for almost HK$37 billion and is likely to encourage further selling pressure. Failure of support at 22200 would confirm the primary down-trend.
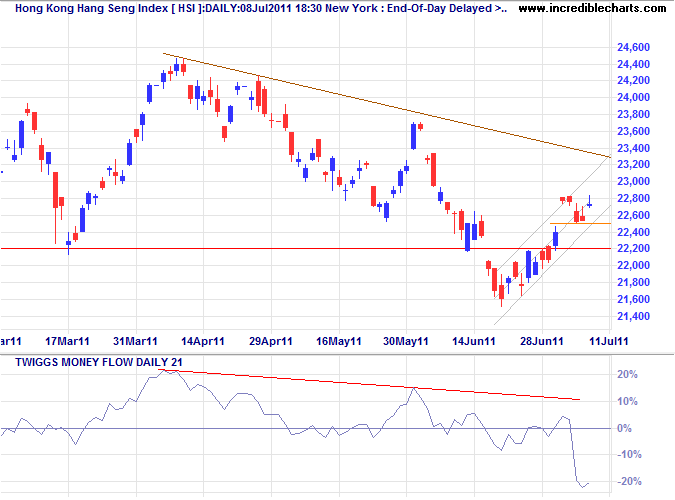
* Target calculation: 22500 - ( 24500 - 22500 ) = 20500
Brazil: Bovespa
The Bovespa Index retreated with a strong red candle on the weekly chart, indicating another test of support at 60500. Failure would offer a target of 57000*. Reversal of 13-week Twiggs Money Flow below zero warns of further selling pressure.
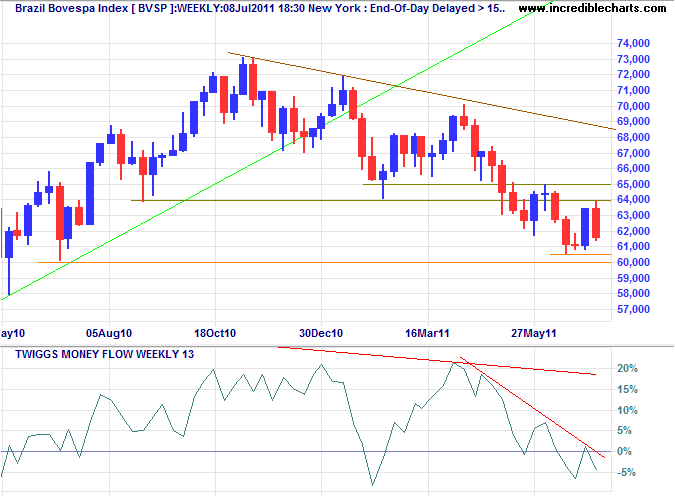
* Target calculation: 64000 - ( 64000 - 60500 ) = 57000
South Africa: JSE
The JSE Overall Index appears headed for a test of 33000, but a weak candle and sharp fall on 13-week Twiggs Money Flow, following bearish divergence, warns of strong selling pressure.
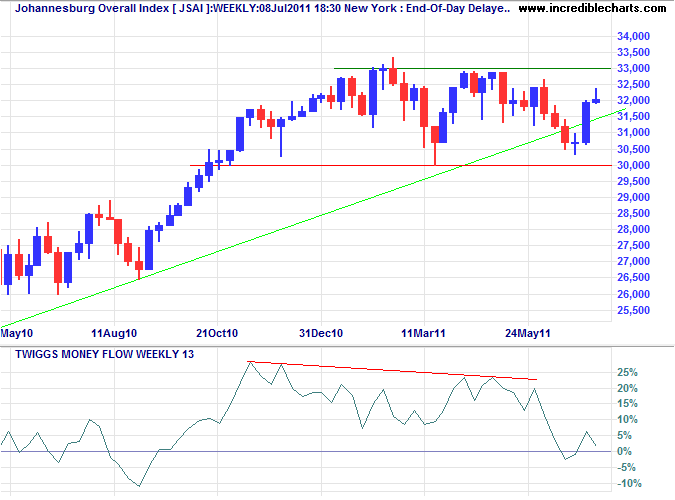
* Target calculation: 33000 + ( 33000 - 30000 ) = 36000
New Zealand: NZX
The NZ50 is testing medium-term support at 3420. Failure would test the primary level at 3300. The sharp fall on 13-week Twiggs Money Flow warns of strong selling pressure — and a primary reversal.
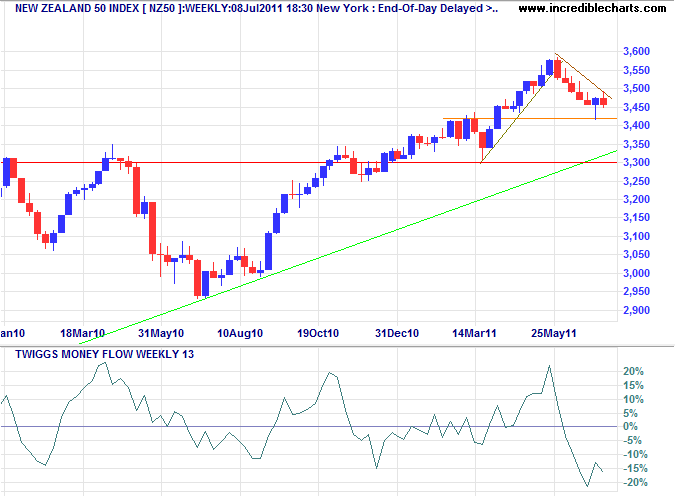
* Target calculation: 3425 + ( 3425 - 3300 ) = 3550
Australia: ASX
The All Ordinaries retreated sharply, headed for another test of primary support at 4600. Failure would signal a primary down-trend — confirmed if support at 4500 is breached. Reversal of 21-day Twiggs Money Flow below zero confirms strong selling pressure.
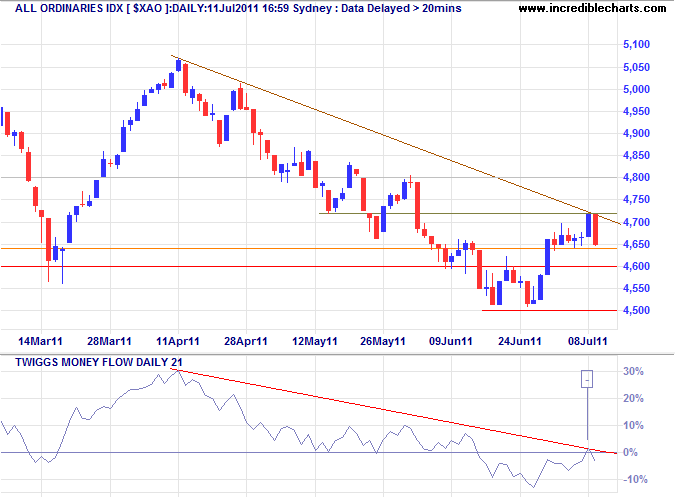
* Target calculation: 4600 - ( 5000 - 4600 ) = 4200
The ASX 200 similarly suggests another test of primary support at 4500.
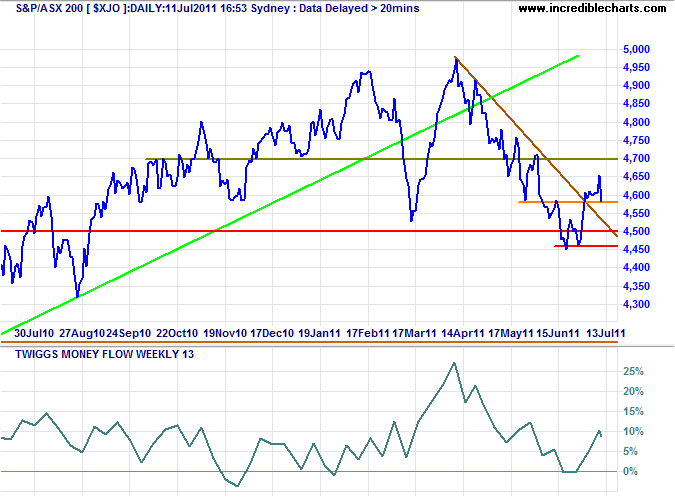
* Target calculation: 4500 - ( 5000 - 4500 ) = 4000
I did precisely the wrong thing. The cotton showed me a loss and I kept it. The wheat showed me a profit and I sold it out. Of all the speculative blunders there are few greater than trying to average a losing game. Always sell what shows you a loss and keep what shows you a profit.
~ Jesse Livermore in Reminiscences of a Stock Operator

Author: Colin Twiggs is a former investment banker with almost 40 years of experience in financial markets. He co-founded Incredible Charts and writes the popular Trading Diary and Patient Investor newsletters.
Using a top-down approach, Colin identifies key macro trends in the global economy before evaluating selected opportunities using a combination of fundamental and technical analysis.
Focusing on interest rates and financial market liquidity as primary drivers of the economic cycle, he warned of the 2008/2009 and 2020 bear markets well ahead of actual events.
He founded PVT Capital (AFSL No. 546090) in May 2023, which offers investment strategy and advice to wholesale clients.
