Gold and dollar triangles
By Colin Twiggs
July 7th, 2011 4:00 a.m. ET (6:00 p:m AET)
These extracts from my trading diary are for educational purposes and should not be interpreted as investment or trading advice. Full terms and conditions can be found at Terms of Use.
Gold
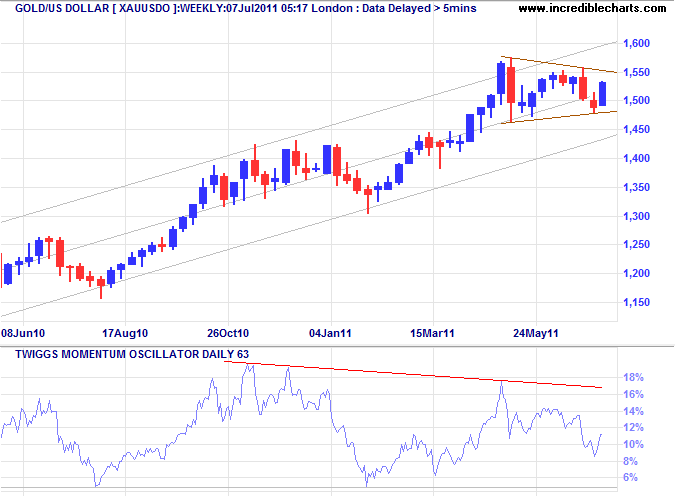
As discussed last week, gold continues in a primary up-trend. The triangle formation on the weekly chart could resolve in either directon: upward signaling a new advance or downward warning of a reversal. Declining 63-day Momentum favors the downside; a fall below 5% would strengthen the signal. Breakout below the trend channel would also warn of a reversal.
The spot price is rallying on the daily chart, headed for a test of $1550/ounce. Breach of the ascending trendline, however, warns of a correction to the long-term trendline. Declining 21-day Momentum strengthens the signal.
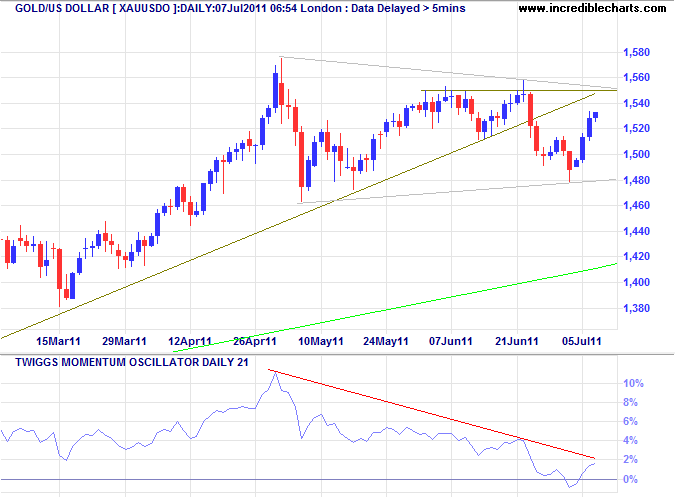
* Target calculation: 1575 + ( 1575 - 1475 ) = 1675
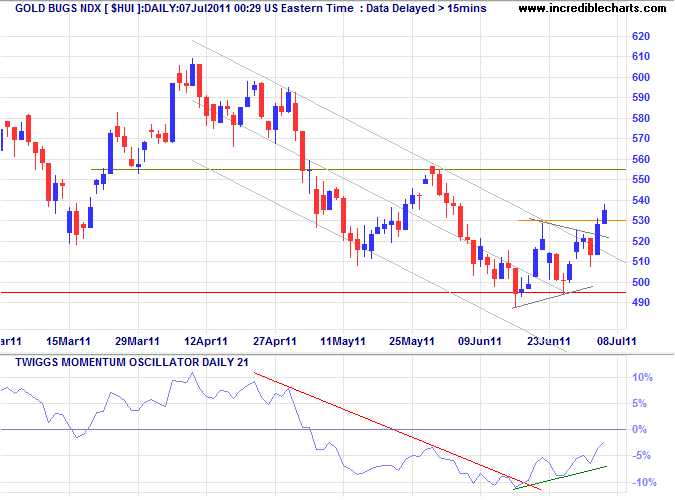
The AMEX Gold Bugs Index ($HUI), reflecting unhedged gold stocks, broke out of its downward trend channel, suggesting buying support for the metal. Follow-through above 530 indicates a test of 555. Respect of the zero line by 21-day Momentum, however, would warn of another down-swing — and failure of support at 495 would confirm.
Silver
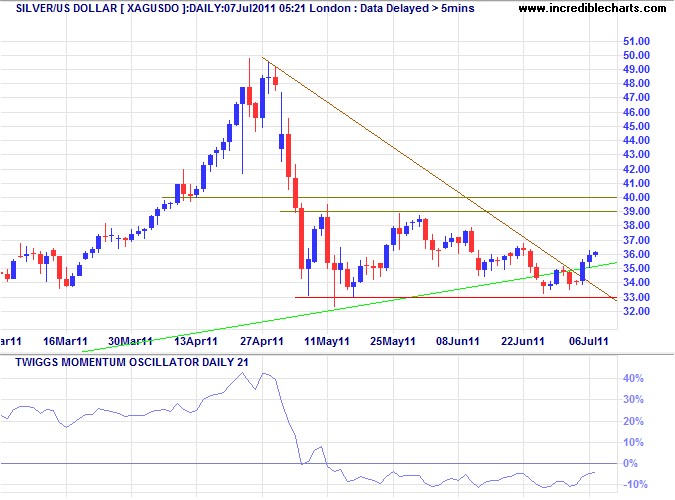
Silver continues to test support at $33, while 21-day Momentum holds below zero. Downward breakout would be bearish for gold.
US Dollar Index
The Dollar Index continues in a triangle formation on the weekly chart. Breach of resistance at 76.00/76.50 would signal a primary trend reversal, while failure of support at 74 would warn of another decline — with a target of 70*. With 63-day Momentum below zero, expect continuation of the primary down-trend; a peak that respects the zero line would confirm. Another down-swing would be bullish for gold.
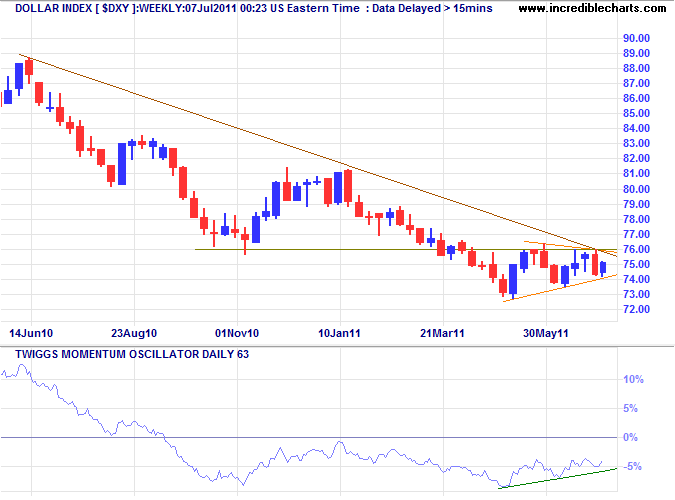
* Target calculation: 74 - ( 76.5 - 72.5 ) = 70
Commodities
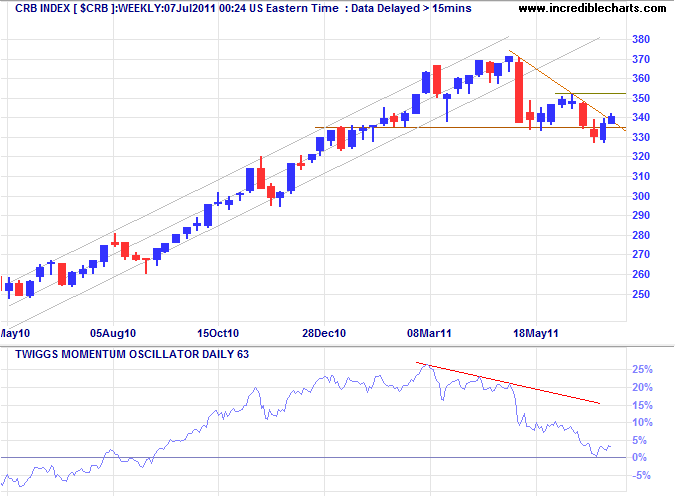
The CRB Commodities Index recovered above 335 to signal another test of 350 on the weekly chart, but bearish divergence on 63-day Momentum continues to warn of a primary down-trend. Recovery above 350 is unlikely but would indicate another advance, while reversal below 335 would confirm the down-trend. Direction of the dollar is again likely to have a strong influence.
Crude Oil
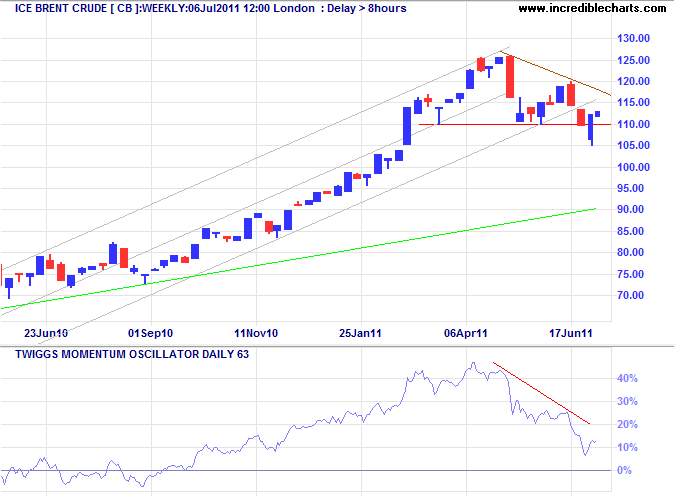
Brent crude is almost a mirror image of the CRB index (of which it is a sizable component), but with support at $110 and resistance at $120.
Euro
The euro is also in a triangle formation, with 21-day Momentum oscillating close around zero, reflecting consolidation. Breakout above $1.46 would indicate another advance, with a target of $1.56*; while a fall below $1.41 would warn of a reversal — confirmed if primary support at $1.40 is broken.
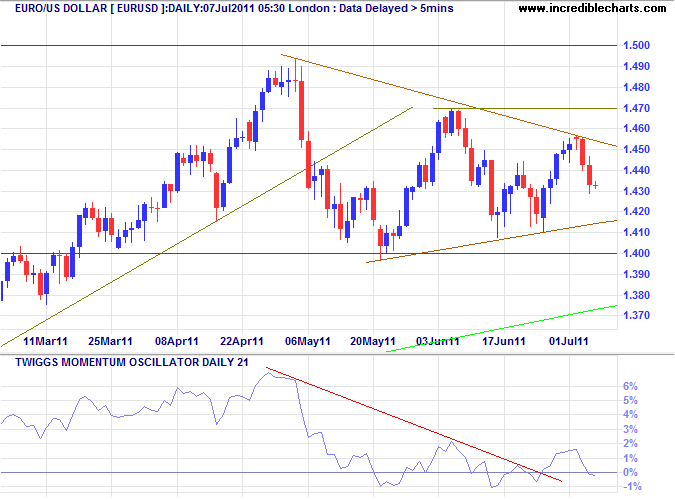
* Target calculation: 1.46 + ( 1.50 - 1.40 ) = 1.56 or 1.41 - ( 1.50 - 1.40 ) = 1.31
Swiss Franc
The Swiss franc continues its primary up-trend against the dollar, but bearish divergence on 21-day Momentum warns of a correction. Breakout below the trend channel on the daily chart — and breach of $1.17 — would confirm.
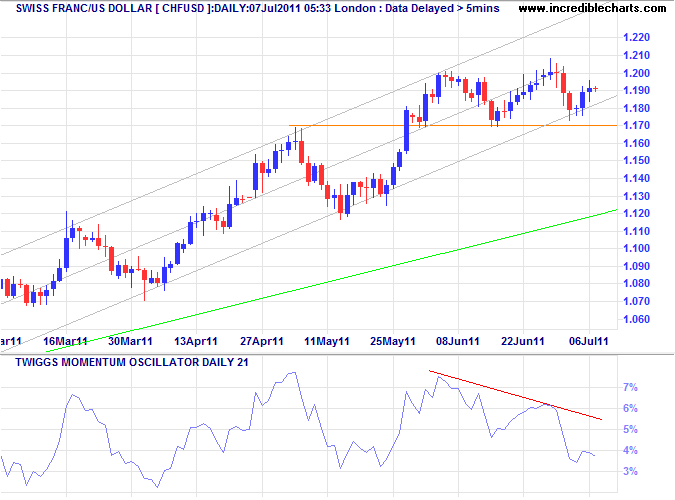
* Target calculation: 1.00 + ( 1.00 - 0.80 ) = 1.20
UK Pound Sterling
The pound retreated below primary support at $1.60 on the weekly chart, warning of a down-trend. Follow-through below $1.59 would confirm a target of $1.53*.
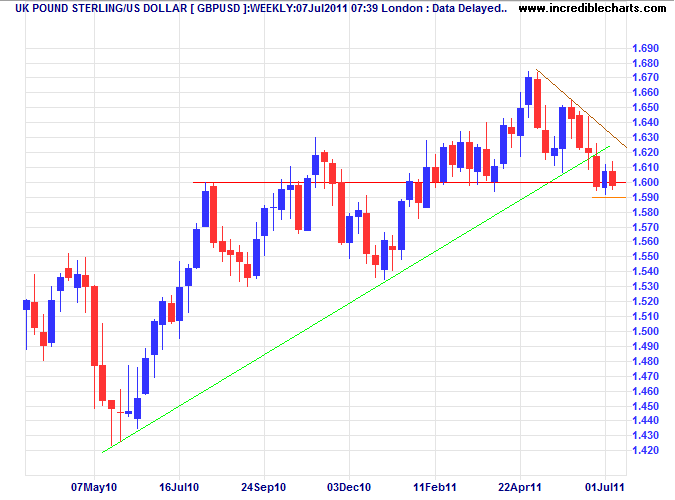
* Target calculation: 1.60 - ( 1.67 - 1.60 ) = 1.53
Japanese Yen
The dollar continues to test support at ¥80; the narrow consolidation is a bearish sign. Failure of support would signal a decline to ¥75*, but would also spur BOJ efforts (as in March) to halt appreciation of the yen. Weak 63-day Momentum, holding below zero, suggests a down-trend.
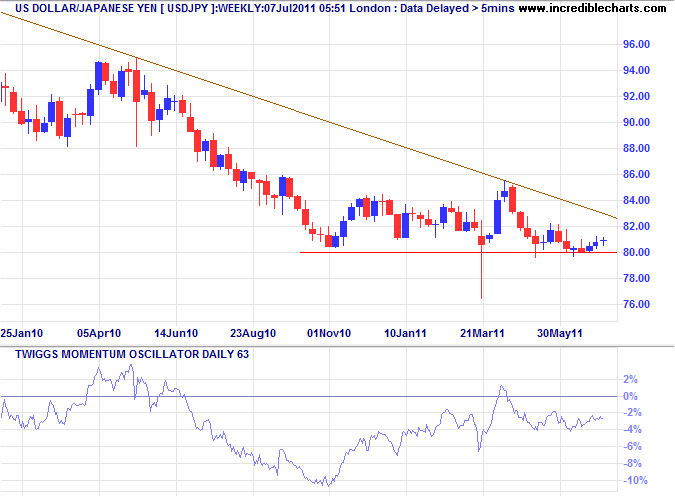
* Target calculation: 80 - ( 85 - 80 ) = 75
New Zealand Dollar
The Aussie dollar has been appreciating against its New Zealand counterpart since early 2009, signaled by 50-week Momentum holding above zero. With weakening commodity prices, AUDNZD is testing support in the $1.28/$1.30 band. There is no hint on the Momentum chart of a reversal, but breach of support would warn of a primary down-trend — with a target of the June 2010 low at $1.22*. Recovery above $1.32, on the other hand, would test the band of resistance at $1.36/$1.38 — and continue the primary up-trend.
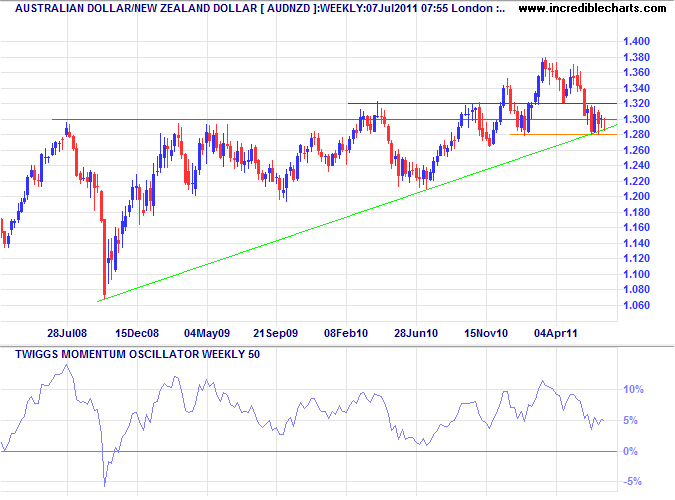
* Target calculation: 1.30 - ( 1.38 - 1.30 ) = 1.22
Australian Dollar
The Aussie dollar is testing resistance at $1.075/$1.080 against the greenback. Follow-through above the declining trendline indicates the correction is over. Short retracement below $1.08 favors a breakout, which would signal an advance to $1.12*. Reversal below $1.04 is now unlikely, but would test parity at $1.00. 21-day Momentum close to zero indicates no clear trend, but a trough that respects the zero line would suggest an advance. We also need to keep an eye on the CRB index as a confirmed down-trend would weaken the AUD.
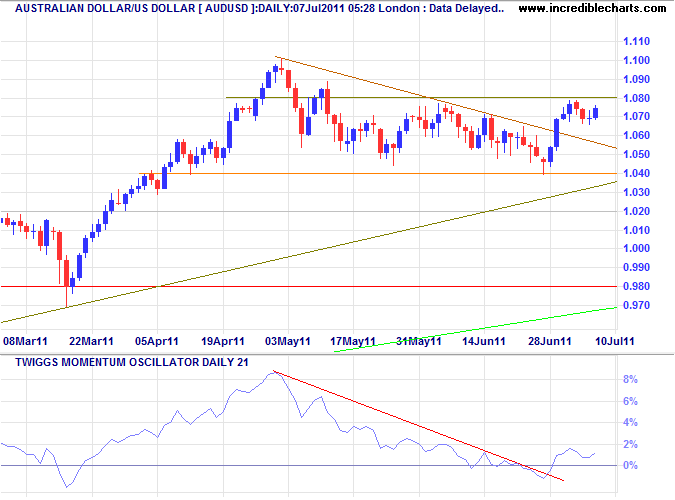
* Target calculation: 1.08 + ( 1.08 - 1.04 ) = 1.12
In general, the men of lower intelligence won out. Afraid of their own shortcomings and of the intelligence of their opponents, so that they would not lose out in reasoned argument or be taken by surprise by their quick-witted opponents, they boldly moved into action. Their enemies, on the contrary, contemptuous and confident in their ability to anticipate, thought there was no need to take by action what they could win by their brains.
~
Thucydides (c. 460 BC - c. 400 BC)

Author: Colin Twiggs is a former investment banker with almost 40 years of experience in financial markets. He co-founded Incredible Charts and writes the popular Trading Diary and Patient Investor newsletters.
Using a top-down approach, Colin identifies key macro trends in the global economy before evaluating selected opportunities using a combination of fundamental and technical analysis.
Focusing on interest rates and financial market liquidity as primary drivers of the economic cycle, he warned of the 2008/2009 and 2020 bear markets well ahead of actual events.
He founded PVT Capital (AFSL No. 546090) in May 2023, which offers investment strategy and advice to wholesale clients.
