The Big Picture
By Colin Twiggs
July 5th, 2011 3:00 a.m. ET (5:00 p.m. AET)
These extracts from my trading diary are for educational purposes and should not be interpreted as investment or trading advice. Full terms and conditions can be found at Terms of Use.
Technical Instability
The market is currently experiencing volatility on a scale last witnessed in the 1930s. The S&P 500 chart for the last 60 years (semi-log scale with trend channel at 3 standard deviations, data courtesy of Yahoo: symbol y_^gspc) shows a broadening formation, starting in 2000, of greater magnitude than anything since the 1930s. The stagflation era of the 1970s is small by comparison, and the crash of October 1987 barely noticeable.
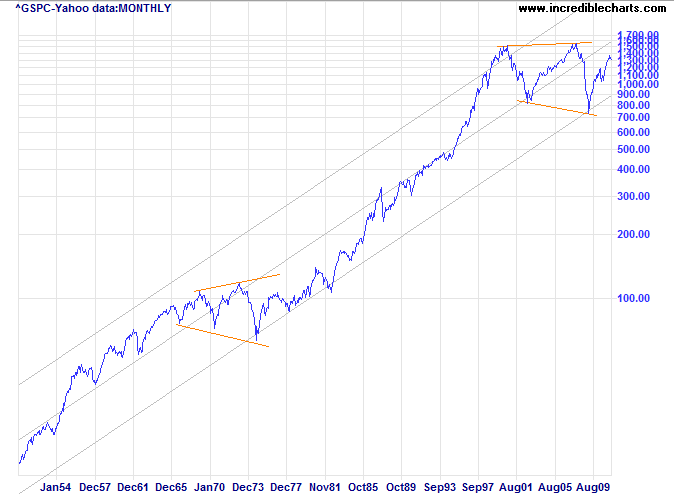
We are not out of the woods yet. High above the 700/800 lows is an inherently unstable situation. A failed down-swing, similar to the 1977-79 trough that respected the lower trend channel, would establish a new base on which the market can build.
3 Fundamental Issues
From a fundamental perspective, I believe investors face three major threats in the next few years.
Most pressing is the sovereign debt/banking crisis in Europe, with France and Germany attempting to postpone the inevitable default of Greece. On its own, Greece is unlikely to shake the European banking system, but if the contagion spreads to Portugal, Ireland, Spain and Italy, the stakes are far higher.
Second on the list is high US inflation and the resulting decline of the dollar. Debasing the currency is the most politically acceptable form of default on its burgeoning debt. Creditors such as China and Japan will protest but have little power to resist: sale of US Treasurys would lead to a rapid appreciation of their own currencies. Some would say they had it coming.
Last is a banking crisis in China, similar to Japan in the 1990s, when their property bubble bursts. A declining US dollar would exacerbate the problem. Given the level of government intervention, a Chinese banking crisis may evolve differently to that in a free market, but the outcome is unavoidable. As Joe Louis would say: you can run, but you can't hide.
I will address these 3 issues in greater detail in later newsletters.
Global Index
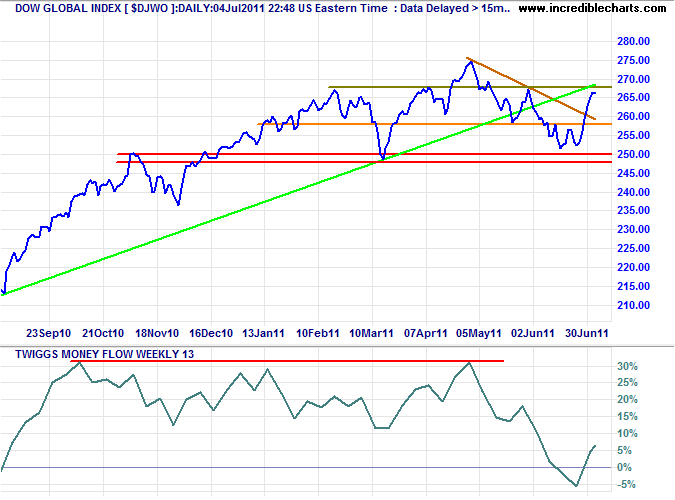
The Dow Jones Global Index broke its descending trendline, indicating the correction is over. Retracement that respects support at 258 would confirm. In the longer term, however, breach of the rising trendline and bearish divergence on 13-week Twiggs Money Flow both warn of a reversal. In the medium term expect a rally to test 275, but failure of the band of primary support at 250 would signal a primary down-trend.
USA
Dow Jones Industrial Average
The Dow followed through above the descending trendline, while 21-day Twiggs Money Flow recovered above zero. Retracement that respects support at 12200 would confirm the correction is over, and signal a test of 12800.
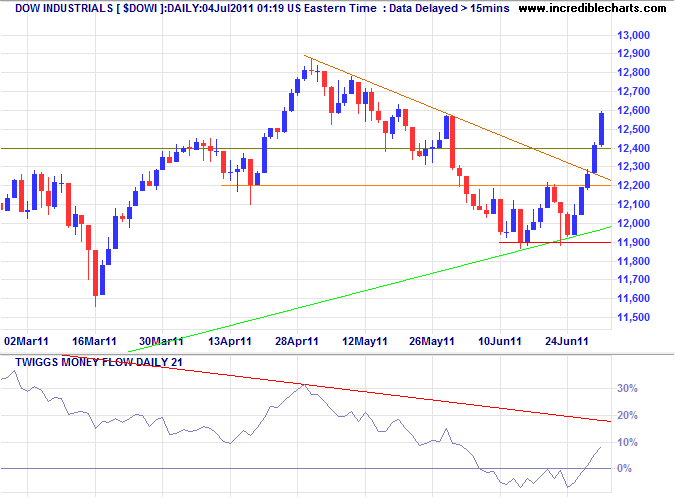
* Target calculation: 12400 + ( 12400 - 11600 ) = 13200
S&P 500
The S&P 500 respected primary support at 1250 and is headed for a test of the April high. Bearish divergence on 13-week Twiggs Money Flow, however, still warns of a reversal, and a breach of 1250 would confirm.
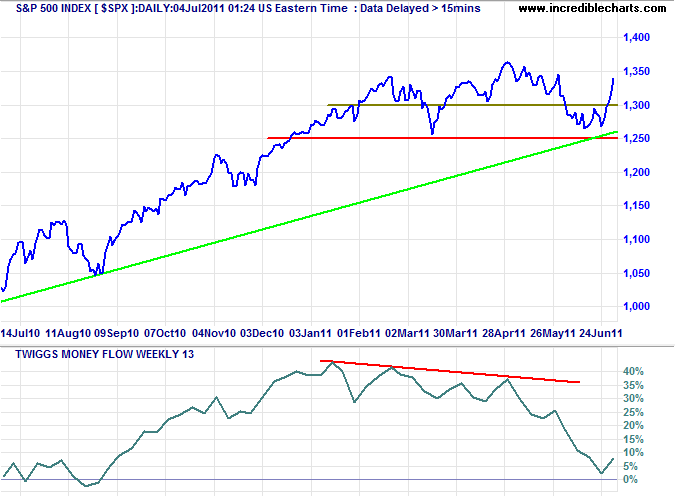
* Target calculation: 1350 + ( 1350 - 1250 ) = 1450 or 1250 - ( 1350 - 1250 ) = 1150
Transport
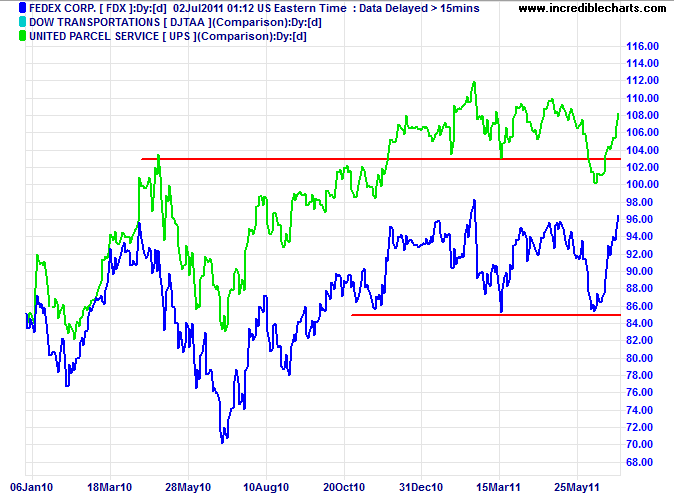
Bellwether transport stock Fedex respected primary support at 85, failing to confirm the primary down-trend signaled by UPS.
Technology
The Nasdaq 100 is headed for a test of 2400, rallying strongly after a false break below primary support. Bearish divergence on 13-week Twiggs Money Flow again warns of a reversal. Breach of 2200 would confirm.
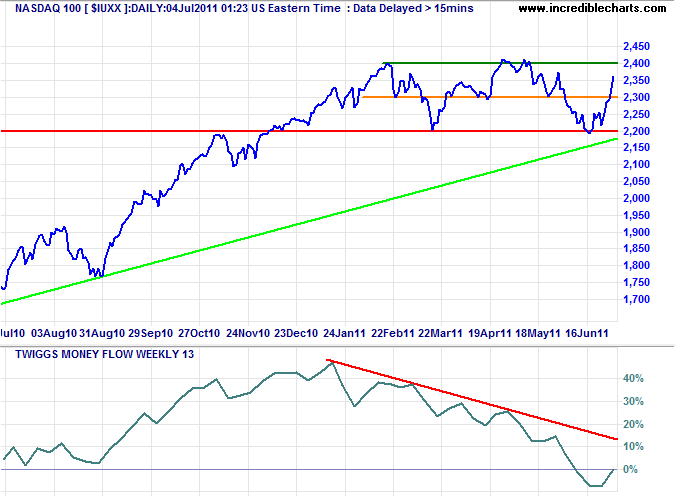
* Target calculation: 2200 - ( 2400 - 2200 ) = 2000 or 2400 + ( 2400 - 2200 ) = 2600
Canada: TSX
The TSX Composite Index found support at the initial target of 12800*, rallying to test resistance at 13500. Breakout above the descending trendline would indicate that the down-trend is weakening, while respect would signal continuation — as would 13-week Twiggs Money Flow reversal below zero.
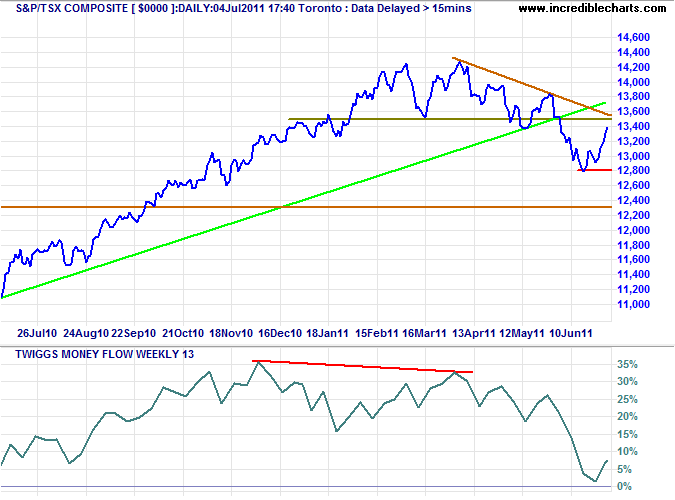
* Target calculation: 13500 - ( 14200 - 13500 ) = 12800
United Kingdom
The FTSE 100 respected its ascending trendline, confirming the primary up-trend is intact. Breakout above 6100 would offer a target of 6500*.
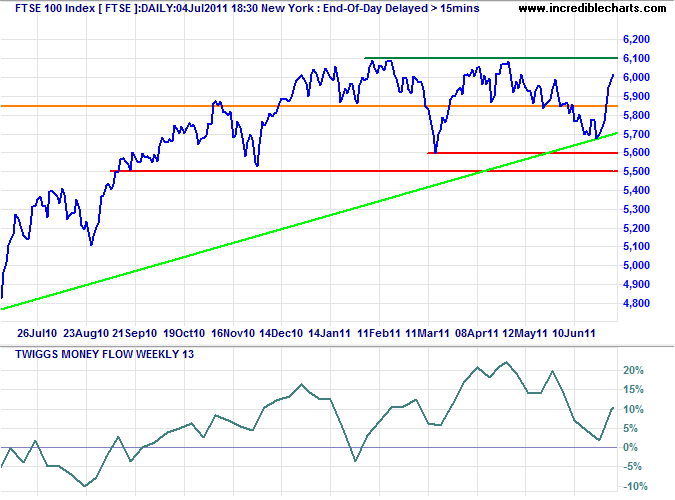
* Target calculation: 6100 + ( 6100 - 5700 ) = 6500 or 5600 - ( 6100 - 5600 ) = 5100
Germany
The DAX is testing resistance at 7500 after respecting the rising trendline. Breakout would complete a higher trough, signaling an advance to 8000*. But bearish divergence on 13-week Twiggs Money Flow continues to warn of long-term selling pressure.
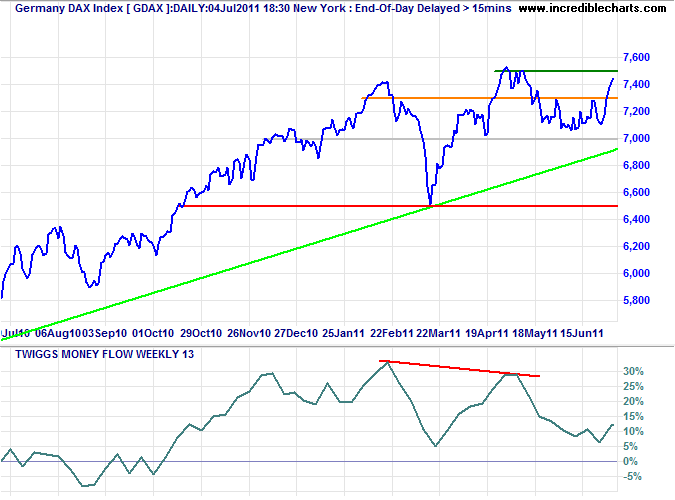
* Target calculation: 7500 + ( 7500 - 7000 ) = 8000
France
The CAC-40 is headed for a test of resistance at 4100 after respecting the rising trendline at 3800. Breakout would complete a higher trough, indicating an advance to 4400*. Reversal below 3900, however, would warn of a test of primary support at 3700.
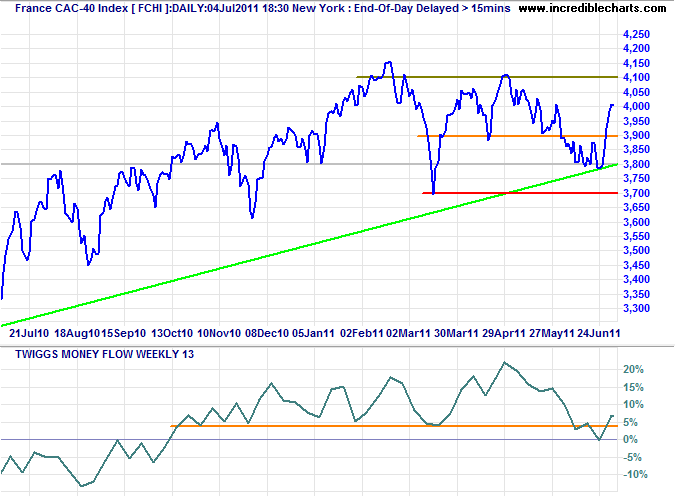
* Target calculation: 4100 + ( 4100 - 3800 ) = 4400
India
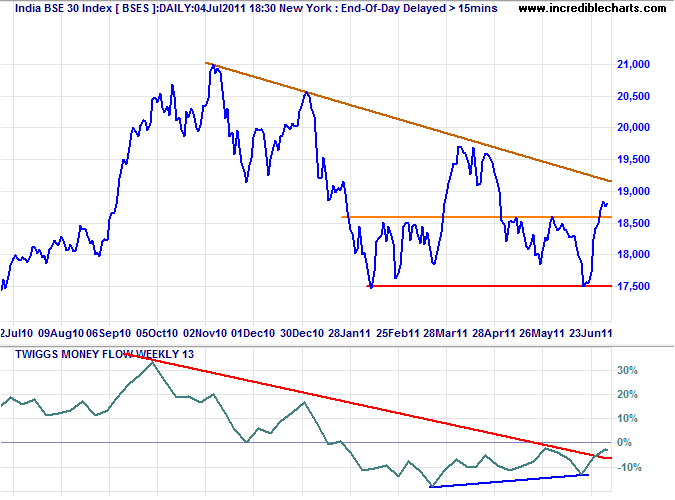
The Sensex opened lower Tuesday after breaking out above 18600. Expect retracement to test the new support level. Penetration of the ascending trendline would warn that the primary down-trend is weakening. Bullish divergence on 13-week Twiggs Money Flow suggests a reversal and recovery above zero would strengthen the signal.
Singapore
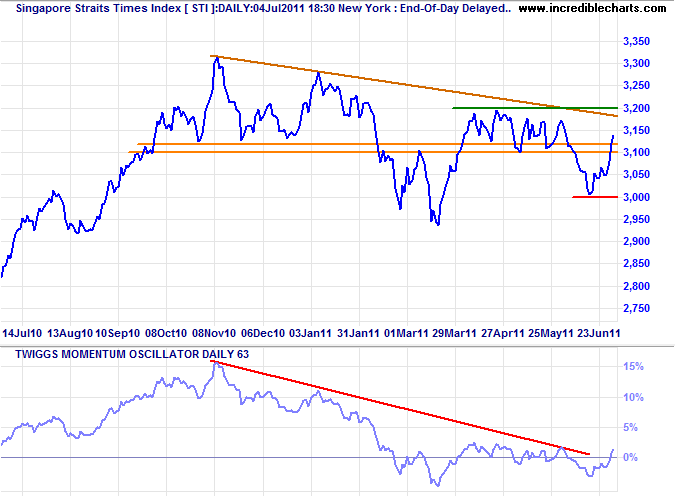
The Straits Times Index opened lower Tuesday but remains headed for a test of 3200, while 63-day Momentum suggests that the down-trend is weakening. Breakout above 3200 would complete a higher trough, signaling an up-trend, while reversal below 3100 would warn of another down-swing.
Japan
The Nikkei 225 is testing 10000, while rising 13-week Twiggs Money Flow indicates buying pressure. Breakout would offer a target of 10600*. Reversal below 9400, however, would test primary support at 8600/8800.
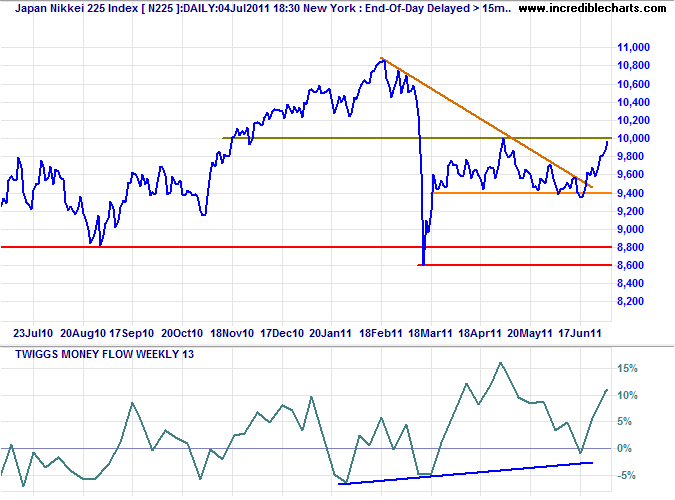
* Target calculation: 10000 + ( 10000 - 9400 ) = 10600
South Korea
The Seoul Composite Index broke through resistance at 2150 Tuesday, signaling another test of the April high. Respect of the rising trendline confirms the up-trend is intact, but bearish divergence on 13-week Twiggs Money Flow warns of weakness ahead.
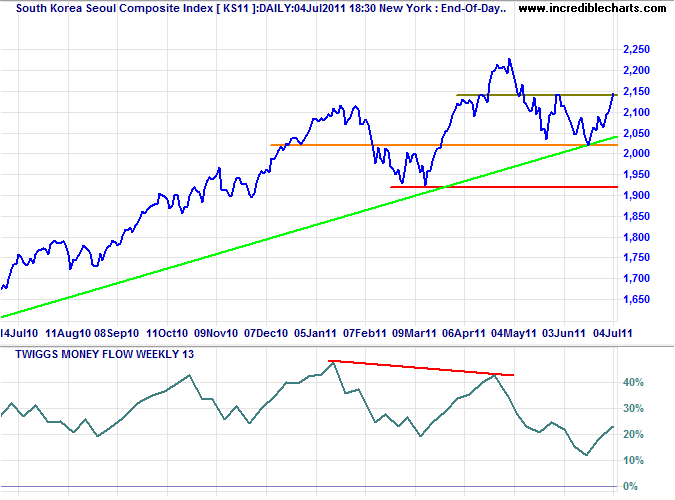
* Target calculation: 2100 + ( 2100 - 1900 ) = 2300
Taiwan
The Dow Jones Taiwan Index is testing resistance at 208. Breakout would signal a test of 216, but bearish divergence on 13-week Twiggs Money Flow and breach of the rising trendline continue to warn of weakness.
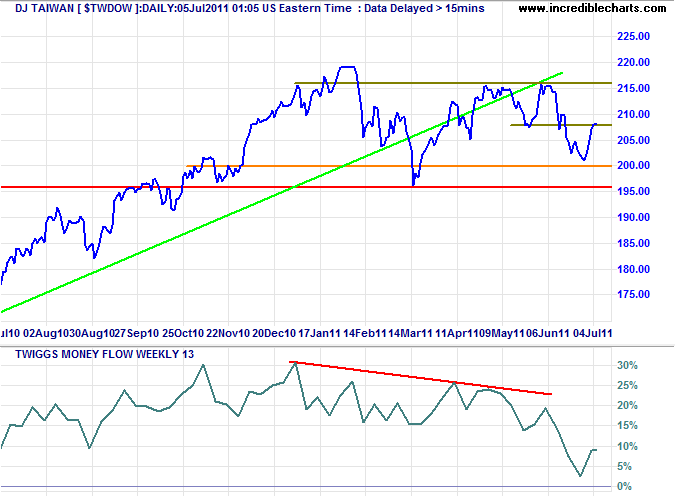
* Target calculation: 220 + ( 220 - 195 ) = 245
China
The Shanghai Composite Index followed through above medium-term resistance at 2760, confirming that the correction has ended. Bullish divergence on 21-day Twiggs Money Flow indicates medium-term buying support. Expect a rally to test 3050.
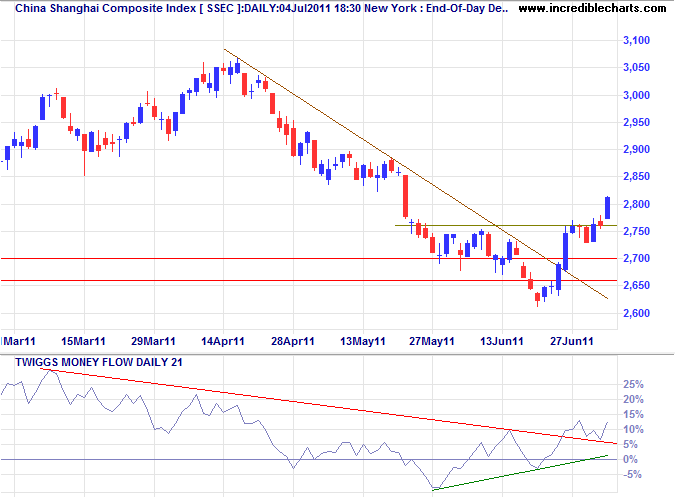
* Target calculations: 2700 - ( 3050 - 2700 ) = 2350
The Hang Seng Index is headed for a test of the declining trendline at 23000. Declining 13-week Twiggs Money Flow continues to warn of long-term selling pressure, penetration of the rising trendline also warns of trend weakness, and respect of the declining trendline would signal another test of support at 21500.
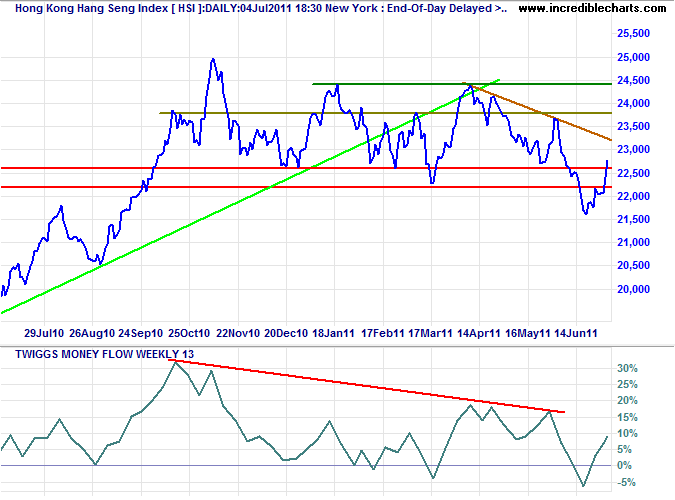
* Target calculation: 22500 - ( 24500 - 22500 ) = 20500
Brazil: Bovespa
The Bovespa Index broke out above the secondary descending trendline, indicating the current down-swing is over. Recovery above 65000 would signal a test of the long-term trendline at 68000. Bullish divergence on 13-week Twiggs Money Flow suggests a reversal, but only breakout above 70000 would confirm.
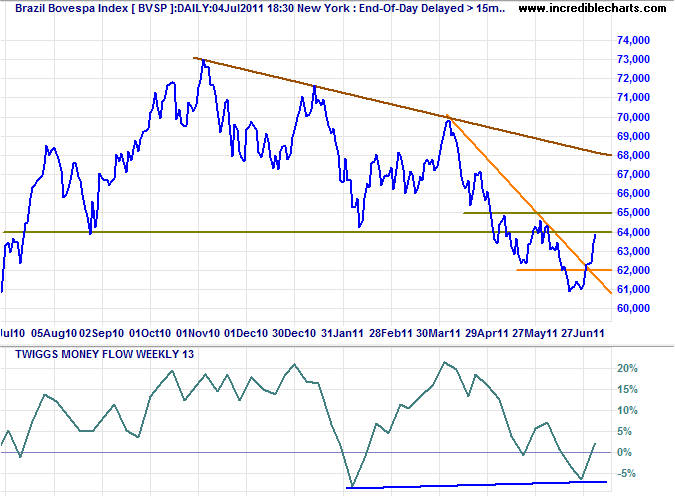
* Target calculation: 64000 - ( 70000 - 64000 ) = 58000
South Africa: JSE
The JSE Overall Index recovered above resistance at 31400, indicating a test of 33000. Bearish divergence on 13-week Twiggs Money Flow, however, continues to warn of selling pressure.
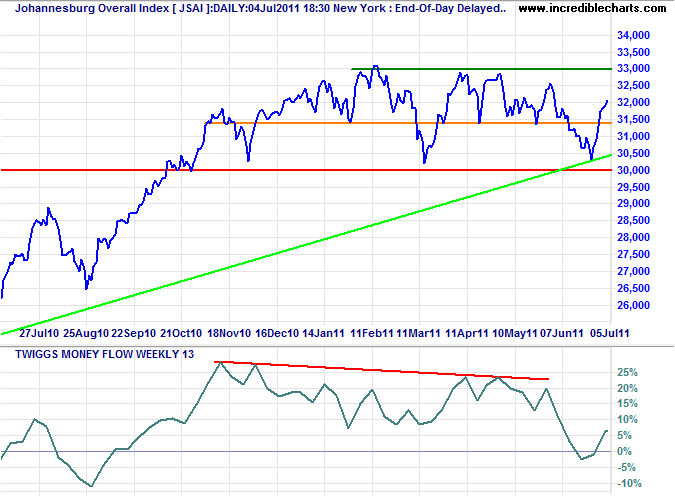
* Target calculation: 33000 + ( 33000 - 30000 ) = 36000
New Zealand: NZX
The NZ50 also broke its descending trendline, suggesting the correction is over. But the sharp fall on 13-week Twiggs Money Flow warns of strong selling pressure. Reversal below 3430 would test primary support at 3300.
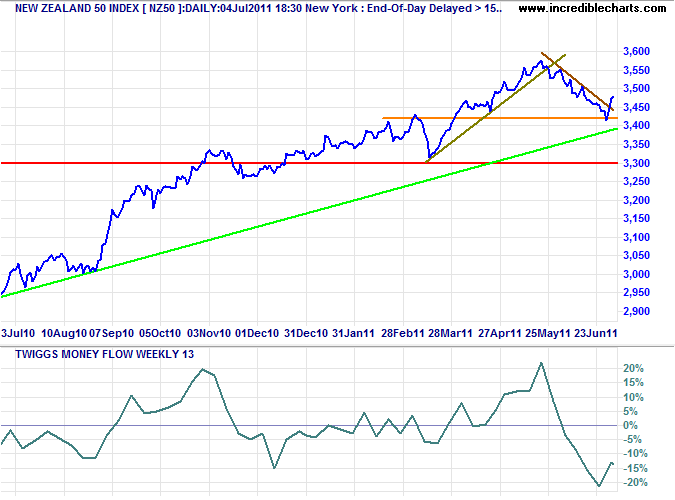
* Target calculation: 3425 + ( 3425 - 3300 ) = 3550
Australia: ASX
The All Ordinaries broke out of its trend channel, indicating the correction is over, but 21-day Twiggs Money Flow holding below zero warns of continued selling pressure. Reversal below 4600 would confirm the primary down-trend, with an initial target of 4200*.
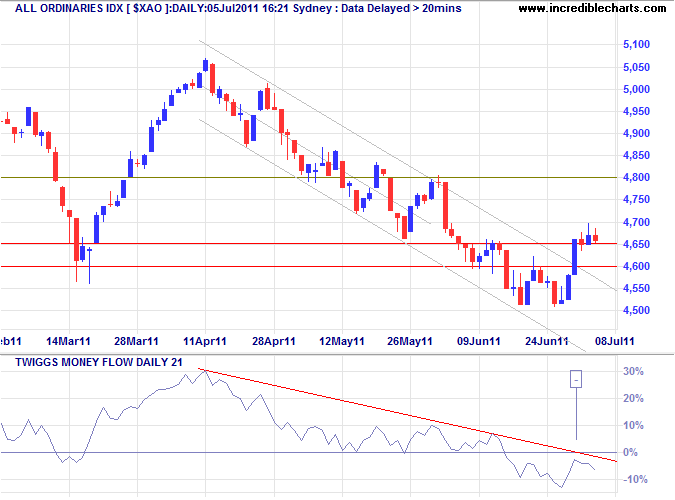
* Target calculation: 4600 - ( 5000 - 4600 ) = 4200
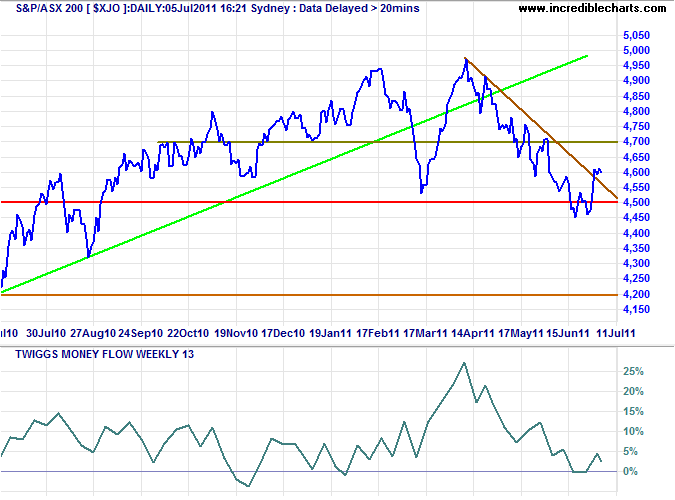
Reversal of the ASX 200 below primary support at 4500 would confirm the bear trend. And 13-week Twiggs Money Flow below zero would strengthen the signal.
A speculator must concern himself with making money out of the market and not with insisting that the tape must agree with him. Never argue with it or ask for reasons or explanations.
~ Jesse Livermore in Reminiscences of a Stock Operator

Author: Colin Twiggs is a former investment banker with almost 40 years of experience in financial markets. He co-founded Incredible Charts and writes the popular Trading Diary and Patient Investor newsletters.
Using a top-down approach, Colin identifies key macro trends in the global economy before evaluating selected opportunities using a combination of fundamental and technical analysis.
Focusing on interest rates and financial market liquidity as primary drivers of the economic cycle, he warned of the 2008/2009 and 2020 bear markets well ahead of actual events.
He founded PVT Capital (AFSL No. 546090) in May 2023, which offers investment strategy and advice to wholesale clients.
