Gold's three trends
By Colin Twiggs
June 30th, 2011 11:00 p.m. ET (1:00 p:m AET)
These extracts from my trading diary are for educational purposes and should not be interpreted as investment or trading advice. Full terms and conditions can be found at Terms of Use.
Gold
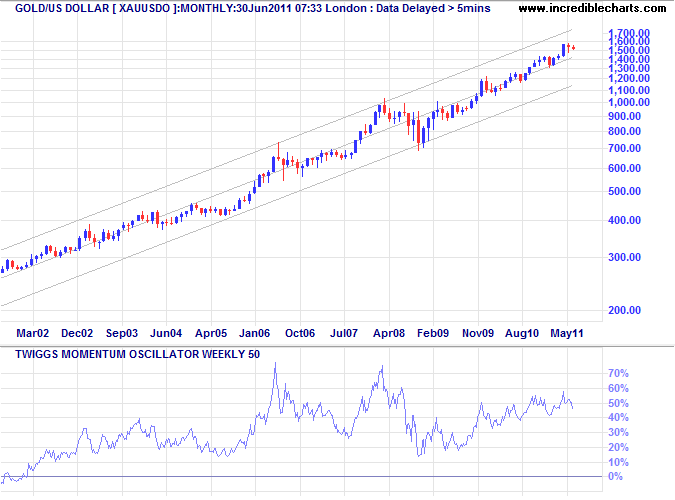
Our Monthly gold chart displays a strong bull-trend since 2001. Confined in a narrow trend channel, with 50-week Momentum holding high above the zero line, there are no signs of a reversal.
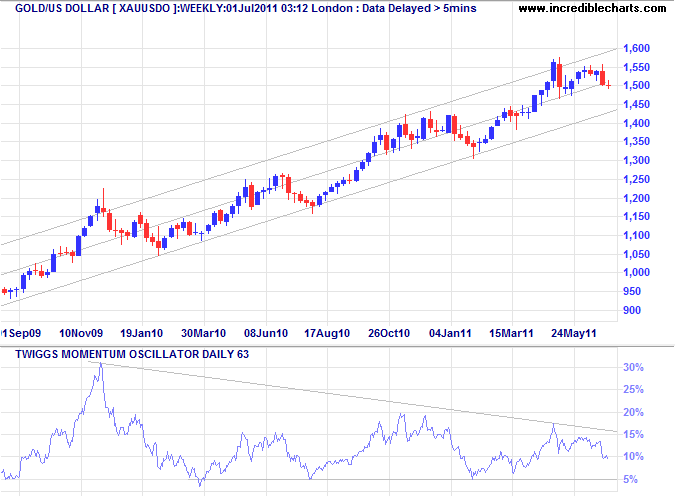
The Weekly chart shows a strong primary trend since May 2009. Momentum is declining, however, and a fall below 5% would warn of trend weakness. Breakout below the trend channel would confirm and signal a test of the lower border on the monthly trend channel — around $1150.
The Daily spot price respected the new resistance level at $1510. That and the break of the ascending trendline both warn of a correction to test the lower border of the weekly trend channel — above $1400. Declining 21-day Momentum strengthens the signal.
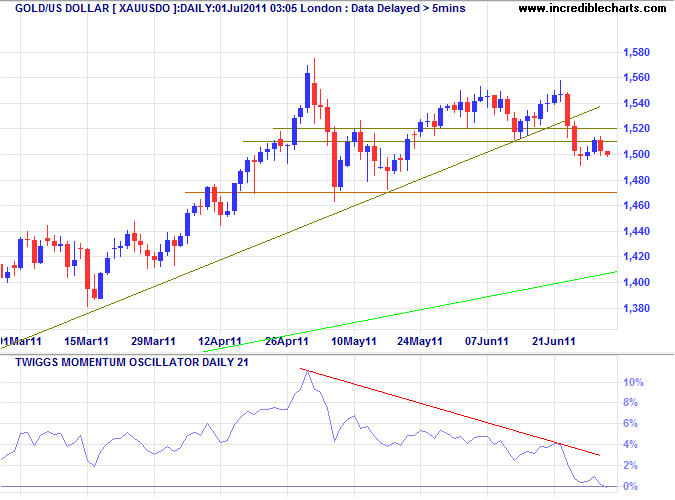
* Target calculation: 1575 + ( 1575 - 1475 ) = 1675
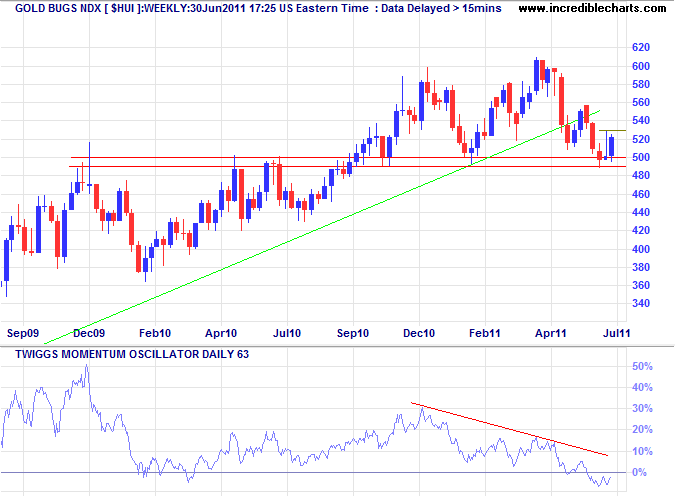
The Weekly chart of AMEX Gold Bugs Index ($HUI), reflecting unhedged gold stocks, is consolidating between 490 and 530 after a false break below support. Recovery above 530 would indicate another test of 600, while failure of support would warn of a primary down-trend — suggesting a similar fate for gold. Bearish divergence on Momentum (63-day) and penetration of the rising trendline both warn of a reversal.
Silver
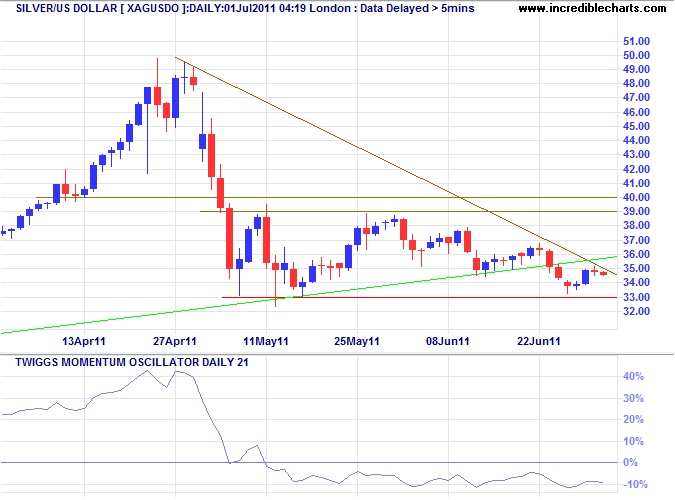
Silver is testing support at $33. Failure would confirm the down-trend signaled by 21-day Momentum holding below zero — again with bearish implications for gold.
US Dollar Index
The Dollar Index is consolidating in a triangle formation below resistance at 76.00/76.50. Breach of short-term support at 74.50 indicates another test of primary support at 73. Momentum oscillating in a narrow band around zero reflects the absence of a trend. Breakout from the triangle will indicate future direction.
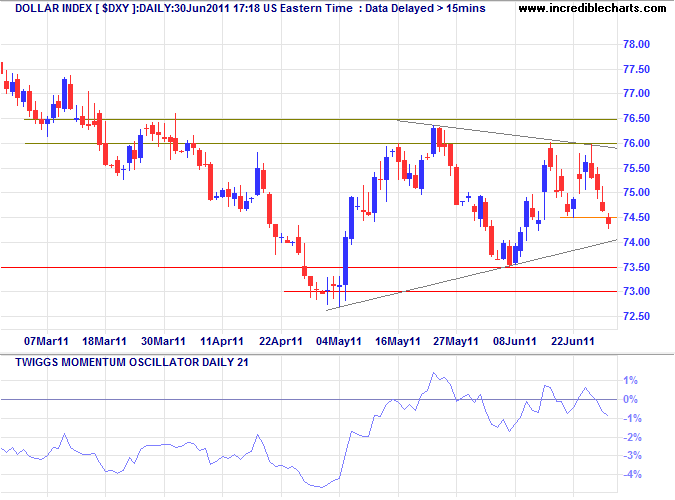
* Target calculation: 73 - ( 76 - 73 ) = 70
Commodities
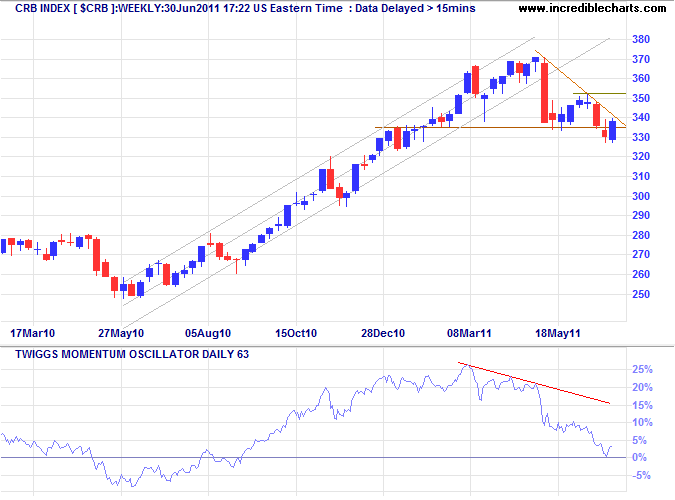
The CRB Commodities Index broke medium-term support at 335 on the Weekly chart but then retreated above the new resistance level. Reversal below 335 would confirm the primary down-trend — first signaled by bearish divergence on 63-day Momentum. Recovery above 350 is unlikely but would indicate another advance. The direction of the dollar is again likely to have a strong influence.
Crude Oil
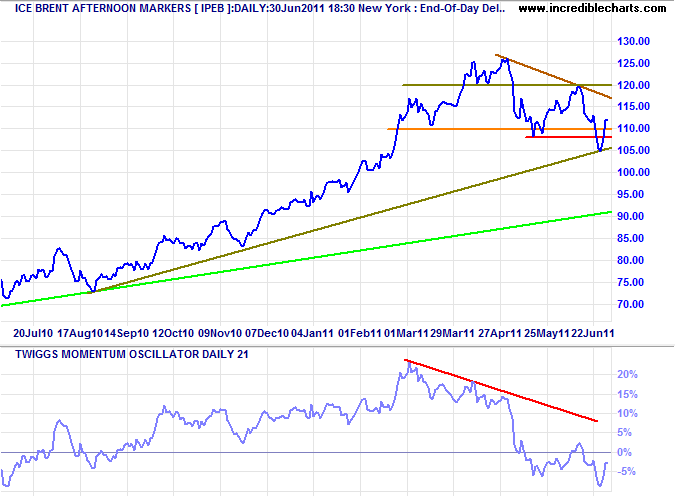
Brent crude similarly retreated after breaking support at $108/barrel. Bearish divergence on 21-day Momentum, however, indicates continuation of the down-trend. Respect of the descending trendline would confirm.
Euro
The euro is testing resistance at $1.45. Breakout would indicate another test of $1.50. Twiggs Momentum (21-day) close to zero indicates no clear trend, but a rise above 2% would suggest a rally.
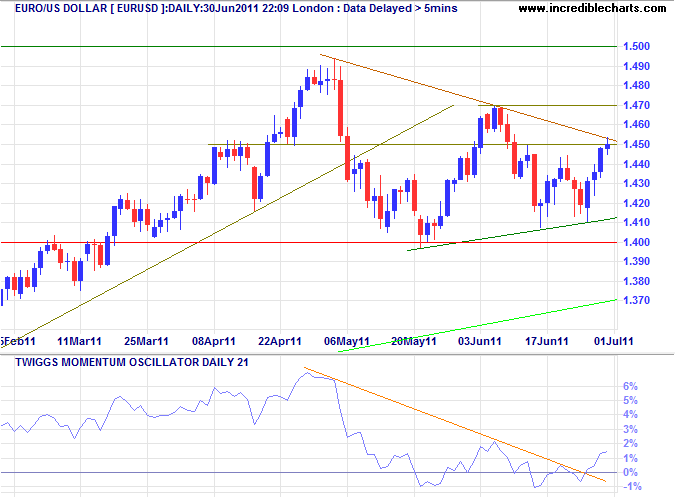
* Target calculation: 1.40 + ( 1.40 - 1.30 ) = 1.50 or 1.40 - ( 1.50 - 1.40 ) = 1.30
Swiss Franc
The Weekly chart shows the Swiss franc continuing its primary up-trend against both the dollar and the euro. Twiggs Momentum (63-day) holding above zero indicates trend strength. Respect of medium-term support at $1.17 would confirm.
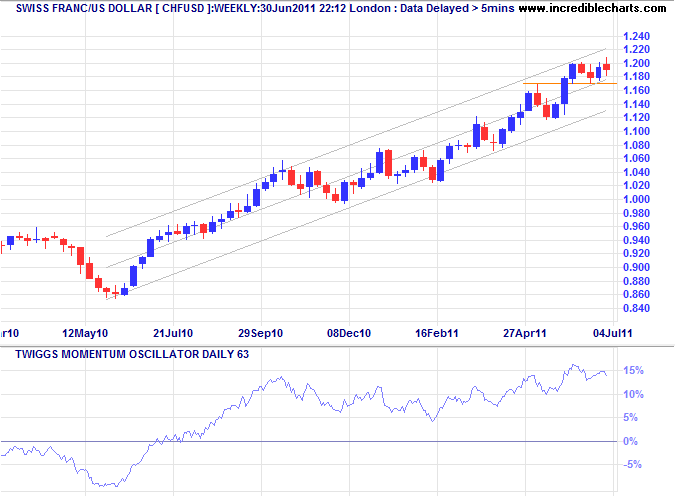
* Target calculation: 1.00 + ( 1.00 - 0.80 ) = 1.20
UK Pound Sterling
The pound continues to test support at $1.60. Failure would test primary support at $1.53. Declining 21-day Momentum suggests weakness.
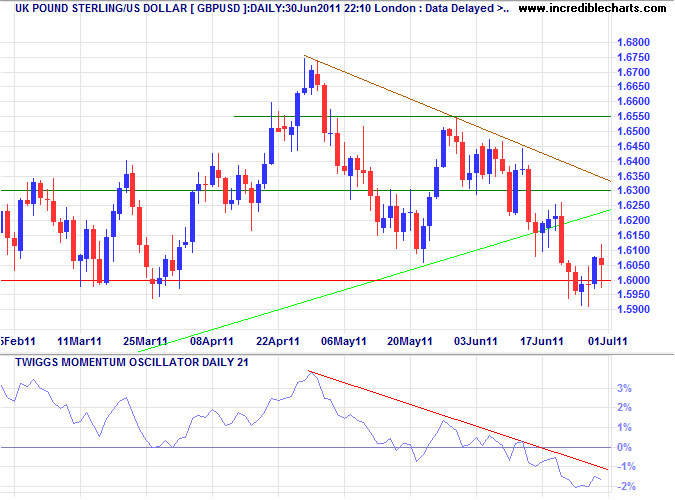
* Target calculation: 1.63 + ( 1.63 - 1.53 ) = 1.73
Japanese Yen
The dollar continues to consolidate in a narrow range above support at ¥80 — a bearish sign. Failure of support would signal a decline to ¥75*, but would also spur further BOJ efforts to halt appreciation of the yen. Twiggs Momentum below zero indicates a down-trend.
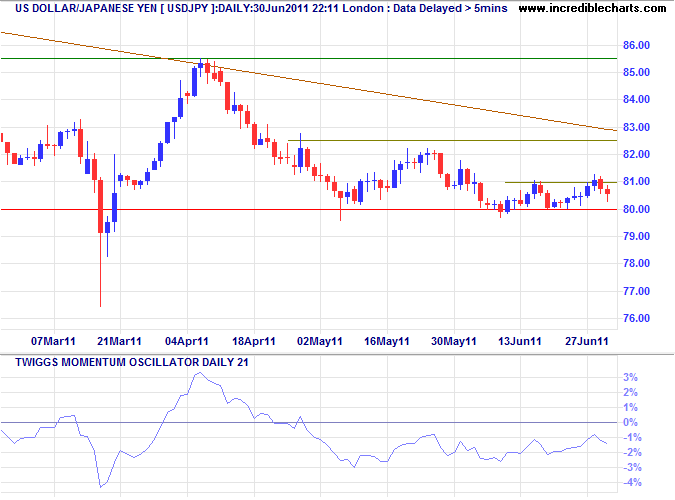
* Target calculation: 80 - ( 85 - 80 ) = 75
New Zealand Dollar
The kiwi dollar broke long-term resistance at $0.82 against the greenback and is now retracing to test the new support level. Respect would indicate a fresh advance, while reversal below $0.80 would signal a correction to test the long-term trendline. Bearish divergence on Twiggs Momentum favors a correction.
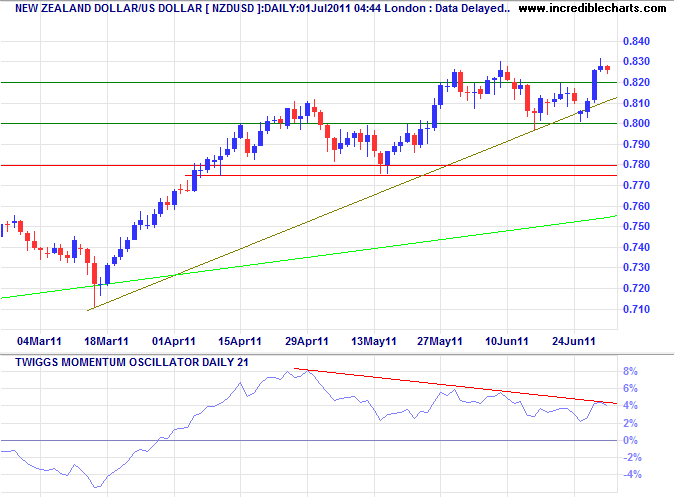
* Target calculation: 81 + ( 81 - 78 ) = 84
Australian Dollar
The Aussie dollar rallied to test resistance at $1.075 against the greenback. Breakout would indicate a fresh advance, while reversal below $1.05 would signal a correction to the long-term trendline at $0.98. Momentum close to zero shows no clear trend. Weaker commodity prices would be a bearish sign.
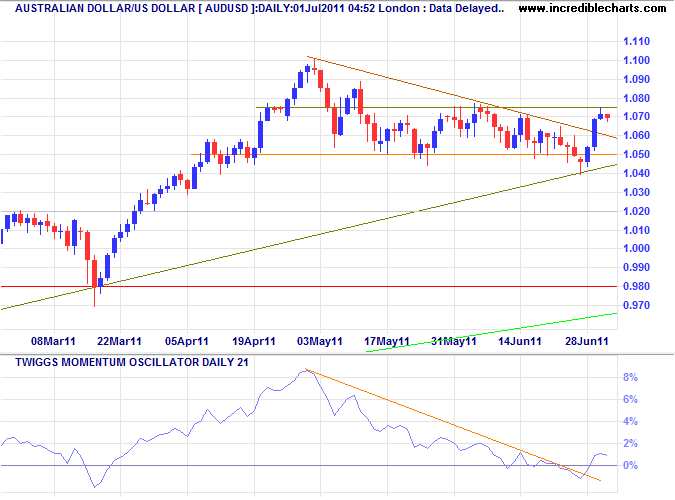
* Target calculation: 1.10 + ( 1.10 - 1.05 ) = 1.15
The bravest are surely those who have the clearest vision of what is before them, glory and danger alike, and yet notwithstanding, go out to meet it.
~
Thucydides (c. 460 BC - c. 400 BC)

Author: Colin Twiggs is a former investment banker with almost 40 years of experience in financial markets. He co-founded Incredible Charts and writes the popular Trading Diary and Patient Investor newsletters.
Using a top-down approach, Colin identifies key macro trends in the global economy before evaluating selected opportunities using a combination of fundamental and technical analysis.
Focusing on interest rates and financial market liquidity as primary drivers of the economic cycle, he warned of the 2008/2009 and 2020 bear markets well ahead of actual events.
He founded PVT Capital (AFSL No. 546090) in May 2023, which offers investment strategy and advice to wholesale clients.
