Temporary reprieve
By Colin Twiggs
June 27th, 2011 7:00 a.m. ET (9:00 p.m. AET)
These extracts from my trading diary are for educational purposes and should not be interpreted as investment or trading advice. Full terms and conditions can be found at Terms of Use.
Chinese markets retreated above primary support, indicating a false break, while the Nasdaq 100 followed a similar path. Market sentiment, however, remains predominantly bearish.
Global
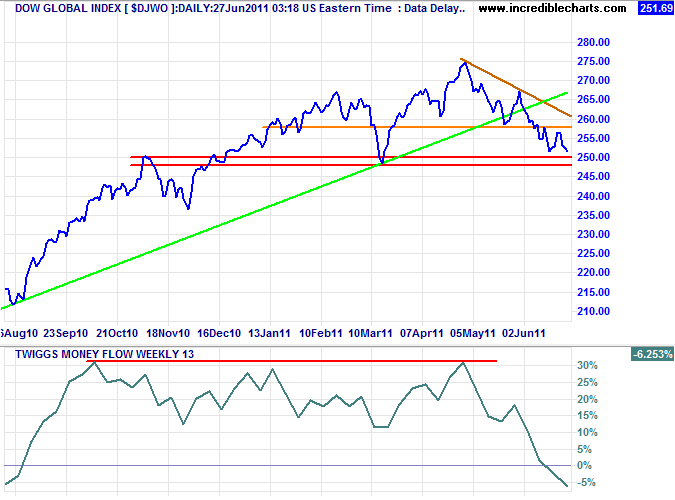
The Dow Jones Global Index 13-week Twiggs Money Flow continues a sharp fall, indicating strong selling pressure. Failure of the band of primary support at 250 would signal reversal to a primary down-trend.
USA
Dow Jones Industrial Average
The Dow is testing short-term support at 11900, while 21-day Twiggs Money Flow (21-day) holding below zero warns of selling pressure. Expect a test of primary support at 11600.
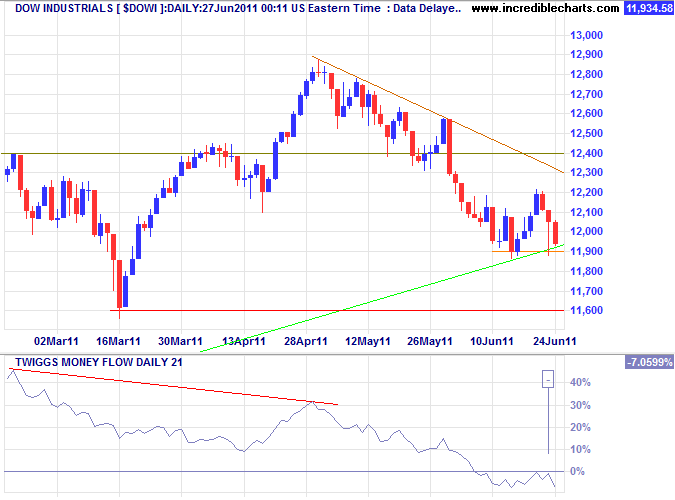
* Target calculation: 12400 + ( 12400 - 11600 ) = 13200
S&P 500
The S&P 500 is testing primary support at 1250. Breach of support would complete a double top with a target of 1150*. Twiggs Money Flow (21-day) holding below zero indicates continued selling pressure.
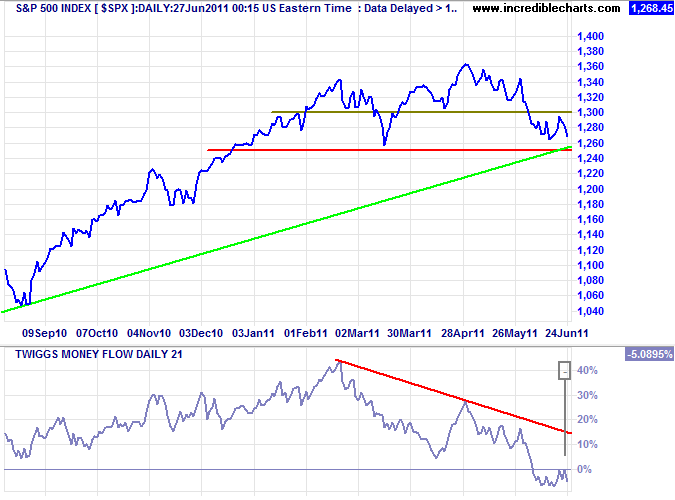
* Target calculation: 1350 + ( 1350 - 1250 ) = 1450 or 1250 - ( 1350 - 1250 ) = 1150
Transport
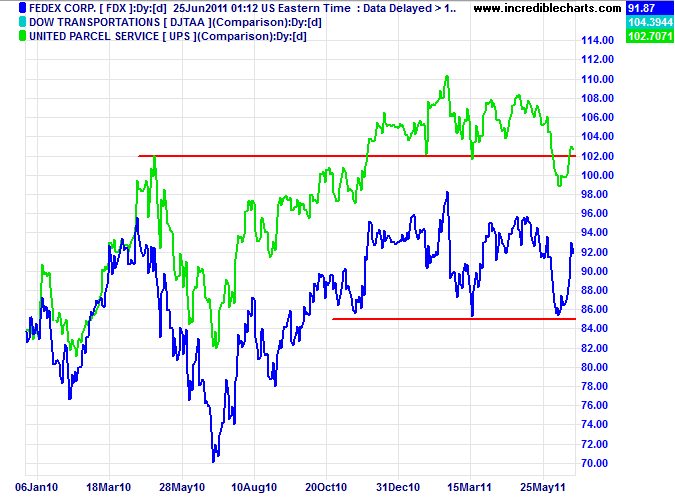
Bellwether transport stock Fedex respected primary support at 85 after reporting strong earnings. Performance, however, was primarily attributable to strong international earnings (boosted by the weaker dollar and lower tax rates), while domestic volumes remained flat [Fedex].
Technology
The Nasdaq 100 retreated above primary support at 2200, but 21-day Twiggs Money Flow below zero continues to indicate selling pressure. Reversal below 2200 would confirm the double top reversal with a target of 2000*.
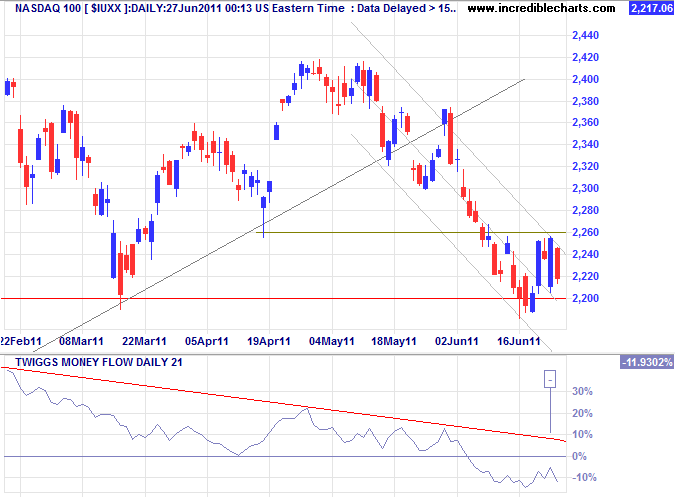
* Target calculation: 2200 - ( 2400 - 2200 ) = 2000
Canada: TSX
The TSX Composite Index is in a primary down-trend, testing support at the initial target of 12800*. Twiggs Money Flow (21-day) below zero indicates continued selling pressure. The next major support level is 12300.
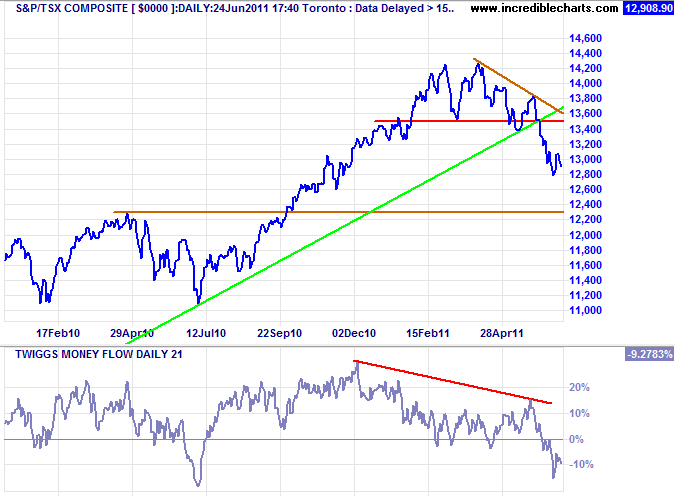
* Target calculation: 13500 - ( 14200 - 13500 ) = 12800
United Kingdom
The FTSE 100 penetration of its ascending trendline warns that the primary trend is weakening. Twiggs Money Flow (21-day) holding below zero indicates continued selling pressure. Breach of primary support at 5600 would complete a double top reversal, offering a target of 5100*.
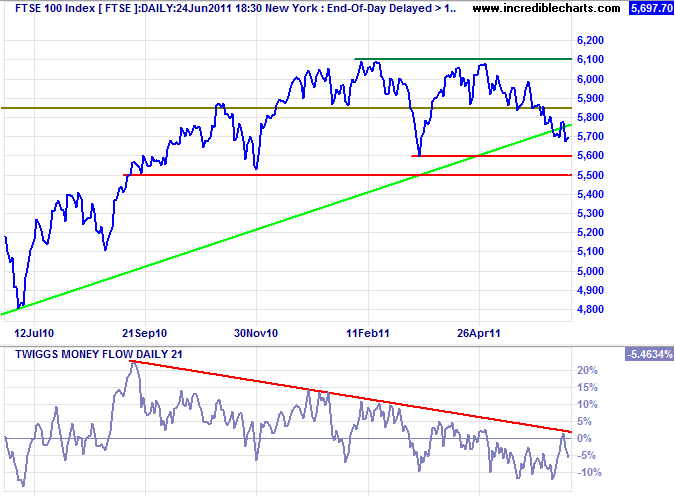
* Target calculation: 6100 + ( 6100 - 5600 ) = 6600 or 5600 - ( 6100 - 5600 ) = 5100
Germany
The DAX continues to test medium-term support at 7000 (and the ascending trendline). Bearish divergence on 13-week Twiggs Money Flow suggests a reversal, with the recent sharp fall indicating rising selling pressure. Breach of 7000 would test primary support at 6500.
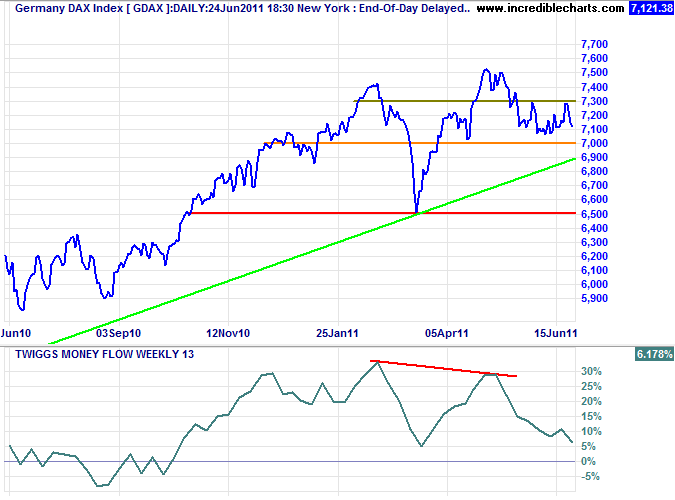
* Target calculation: 7500 + ( 7500 - 6500 ) = 8500
France
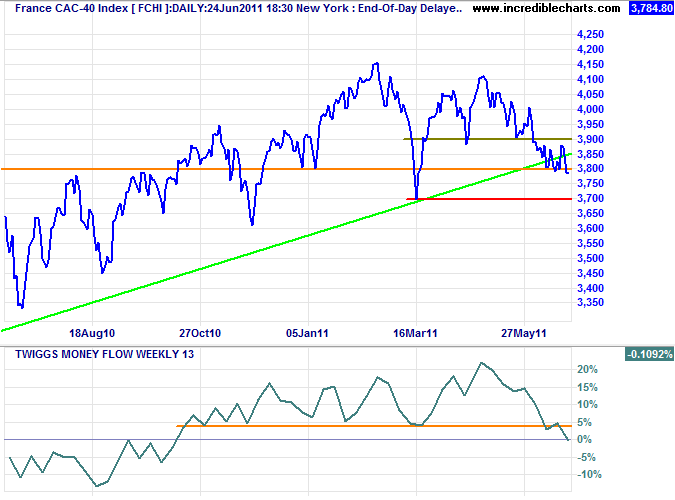
The CAC-40 also warns that the primary trend is weakening, while 13-week Twiggs Money Flow below zero indicates selling pressure. Expect a test of primary support at 3700.
India
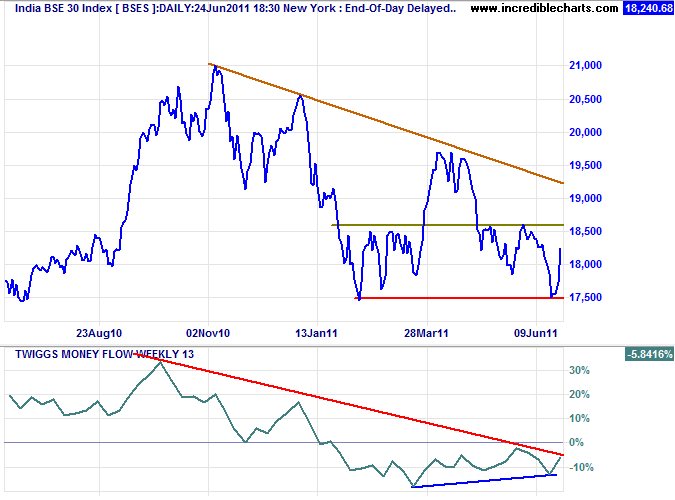
The Sensex tested resistance at 18500 Monday. Bullish divergence on 13-week Twiggs Money Flow indicates buying support. Upward breakout would not signal a reversal, but would offer a target of 19800.
Singapore
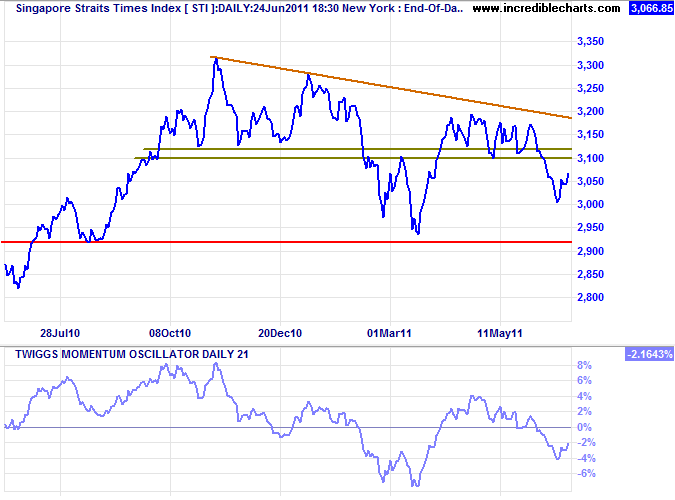
The Straits Times Index is retracing to test the new resistance level at 3100. Respect remains likely and would signal a down-swing to test primary support at 2920.
Japan
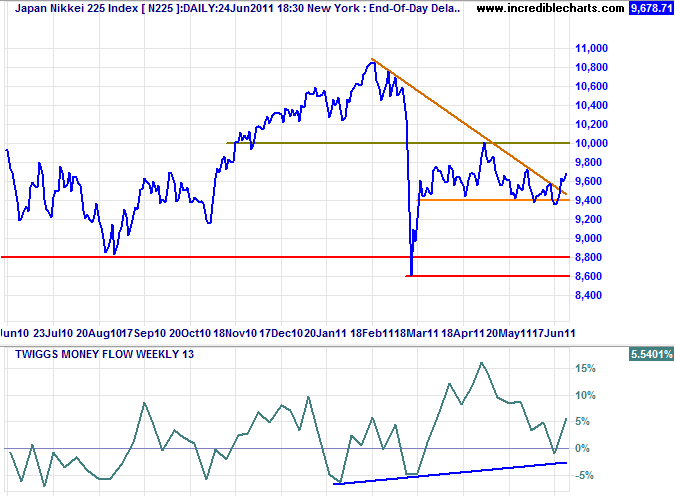
The Nikkei 225 completed a false break below support at 9400. Penetration of the declining trendline indicates another test of 10000. Reversal below medium-term support at 9400, however, would test primary support at 8600/8800.
South Korea
The Seoul Composite Index retreated Monday to re-test medium-term support. Failure of 2040 would test primary support at 1920. Bearish divergence on 13-week Twiggs Money Flow warns of a reversal.
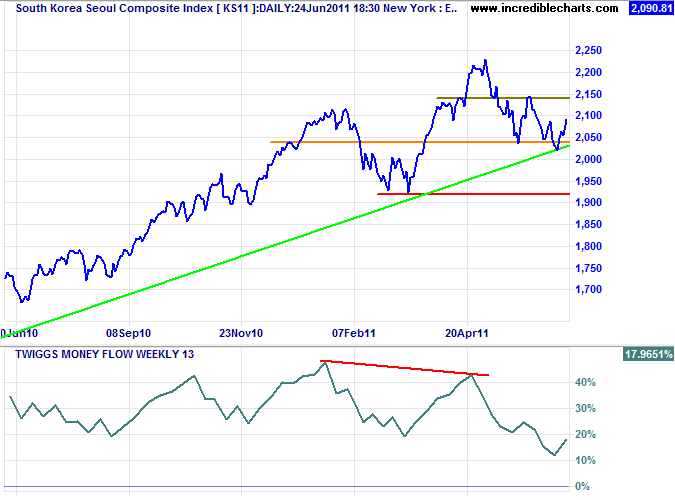
* Target calculation: 2100 + ( 2100 - 1900 ) = 2300
Taiwan
The Dow Jones Taiwan Index broke medium-term support at 205, signaling a test of primary support at 196. The sharp fall on 13-week Twiggs Money Flow indicates strong selling pressure.
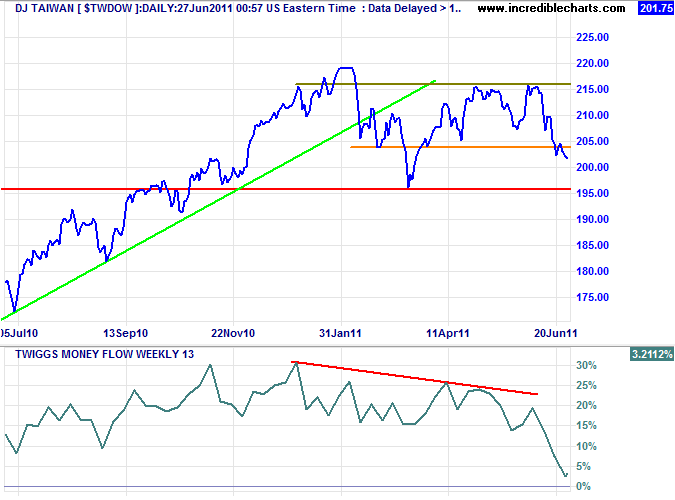
* Target calculation: 220 + ( 220 - 195 ) = 245
China
The Shanghai Composite Index completed a false break, testing medium-term resistance at 2760. Breakout would signal a bear trap. Bullish divergence on 21-day Twiggs Money Flow indicates medium-term buying support.
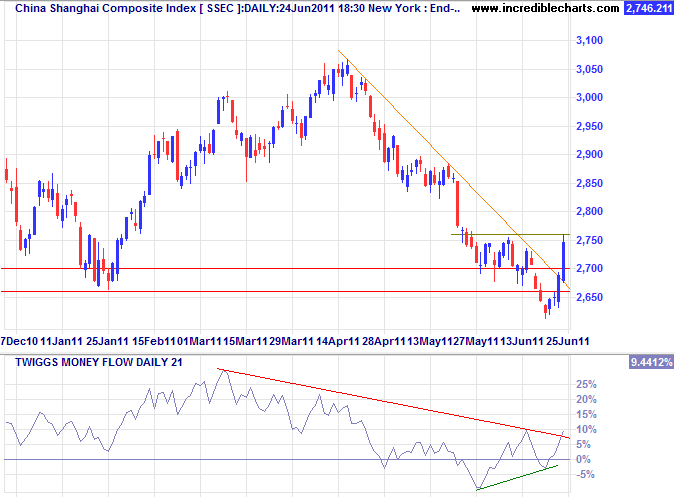
* Target calculations: 2700 - ( 3050 - 2700 ) = 2350
The Hang Seng Index retraced to test the new resistance level at 22200; respect would confirm the primary down-trend. Bullish divergence on 21-day Twiggs Money Flow, however, continues to indicate medium-term buying support.
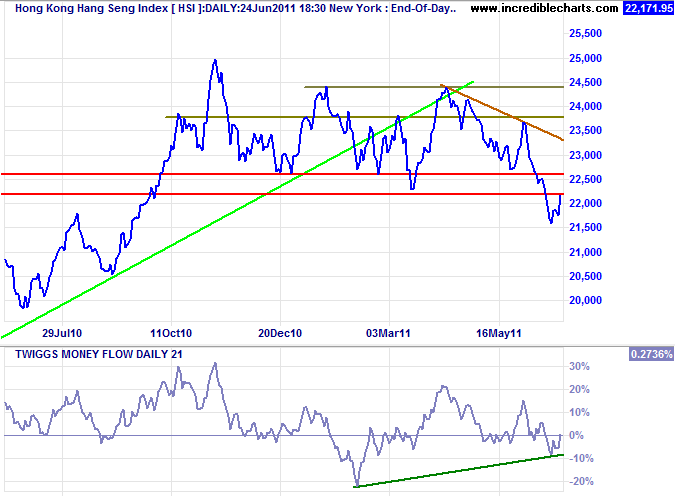
* Target calculation: 22500 - ( 24500 - 22500 ) = 20500
Brazil: Bovespa
The Bovespa Index respected resistance at 65000 and is headed for a test of support at 58000*. Twiggs Money Flow below zero reflects continued strong selling pressure.
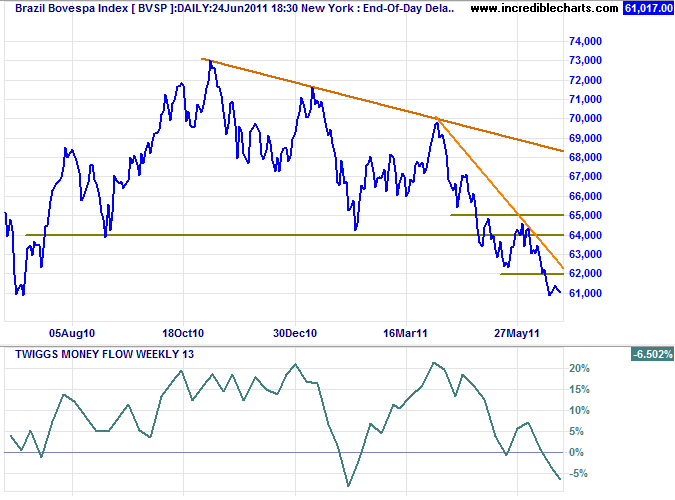
* Target calculation: 64000 - ( 70000 - 64000 ) = 58000
South Africa: JSE
The JSE Overall Index is headed for a test of primary support at 30000; failure would signal a reversal. Penetration of the long-term trendline warns that the up-trend is weakening. Twiggs Money Flow (13-week) reversal below zero confirms selling pressure.
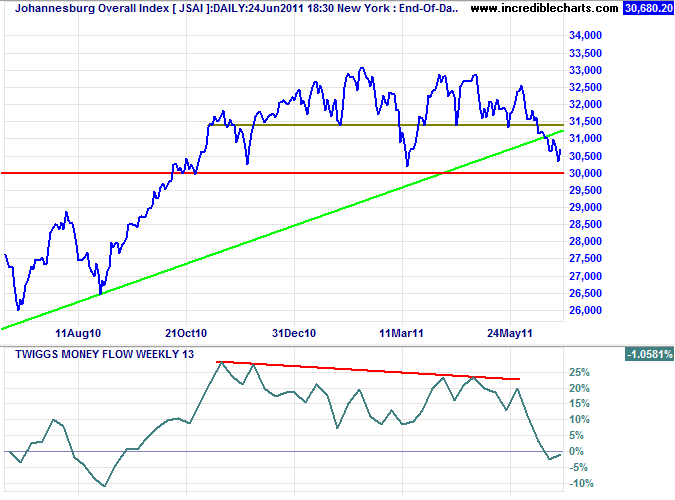
* Target calculation: 33000 + ( 33000 - 30000 ) = 36000
New Zealand: NZX
The sharp fall on 13-week Twiggs Money Flow warns of abnormal selling pressure on the NZ50. Failure of medium-term support at 3430 would test primary support at 3300.
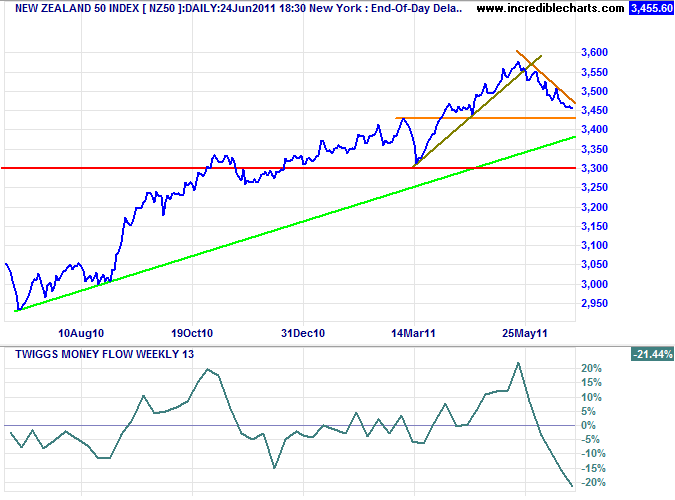
* Target calculation: 3425 + ( 3425 - 3300 ) = 3550
Australia: ASX
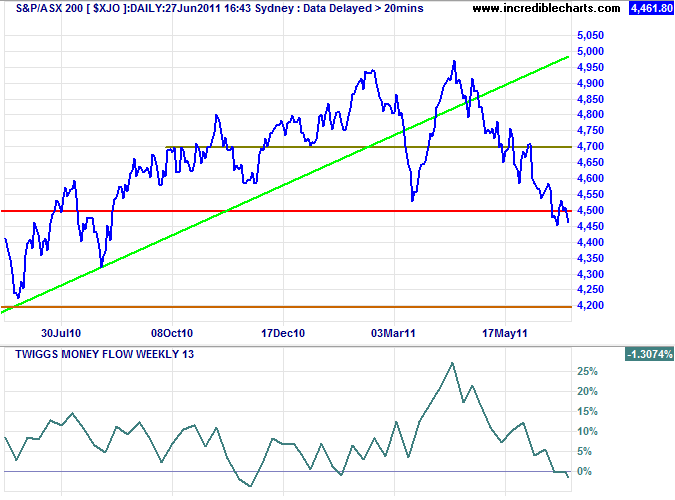
The All Ordinaries respected resistance at 4600, confirming a primary down-trend. Declining 21-day Twiggs Money Flow below zero indicates continued selling pressure. Target for the down-swing is 4200*.
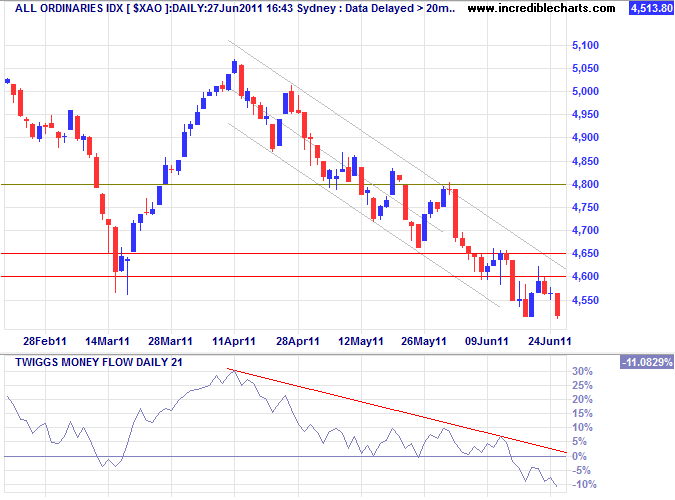
* Target calculation: 4600 - ( 5000 - 4600 ) = 4200
The ASX 200 retreating below primary support at 4500 confirmed the reversal.
The public ought always to keep in mind the elementals of stock trading. When a stock is going up no elaborate explanation is needed as to why it is going up. It takes continuous buying to make a stock keep going up. As long as it does so, with only small and natural reactions from time to time, it is a pretty safe proposition to trail with it.
But if after a long steady rise a stock turns and gradually begins to go down, with only occasionally small rallies, it is obvious that the line of least resistance has changed from upward to downward. Such being the case why should anyone ask for explanations? There are probably very good reasons why it should go down.....
~ Jesse Livermore in Reminiscences of a Stock Operator

Author: Colin Twiggs is a former investment banker with almost 40 years of experience in financial markets. He co-founded Incredible Charts and writes the popular Trading Diary and Patient Investor newsletters.
Using a top-down approach, Colin identifies key macro trends in the global economy before evaluating selected opportunities using a combination of fundamental and technical analysis.
Focusing on interest rates and financial market liquidity as primary drivers of the economic cycle, he warned of the 2008/2009 and 2020 bear markets well ahead of actual events.
He founded PVT Capital (AFSL No. 546090) in May 2023, which offers investment strategy and advice to wholesale clients.
