A quick health check for the economy
By Colin Twiggs
June 15th, 2011 8:00 a.m. ET (10:00 p:m AET)
These extracts from my trading diary are for educational purposes and should not be interpreted as investment or trading advice. Full terms and conditions can be found at Terms of Use.
The level of expansion or contraction of debt is closely linked to the various stages of the economic cycle. Increased borrowing, especially by the corporate sector, points to new investment and job creation. Rapid expansion of debt, however, especially by households, warns of a credit bubble. Contraction heralds an economic down-turn, accompanied by low investment and job losses. Low debt growth suggests consolidation, with little new investment or job creation as corporates and households restore their balance sheets.
The stages reflected by the following four economies vary between contraction and consolidation, with few signs of recovery.
US Economy
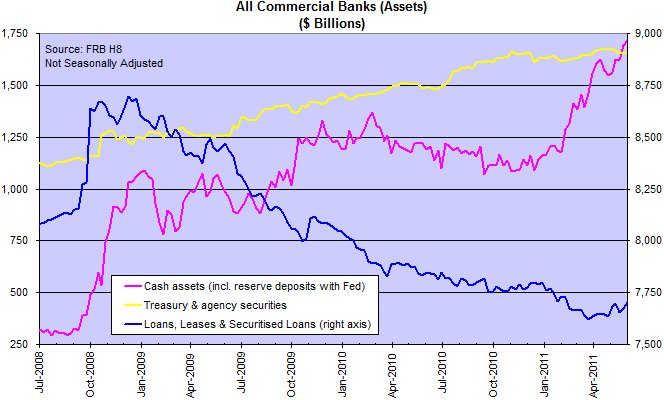
The aggregate balance sheet of US commercial banks shows that new money flowing into the financial system, including the $600 billion from QEII, has been channeled into reserve deposits with the Fed and Treasury & Agency securities. Private investment has not benefited, with loans (including securitized loans) & leases continuing to contract through the first quarter of 2011, before a slight up-tick in the last few months.
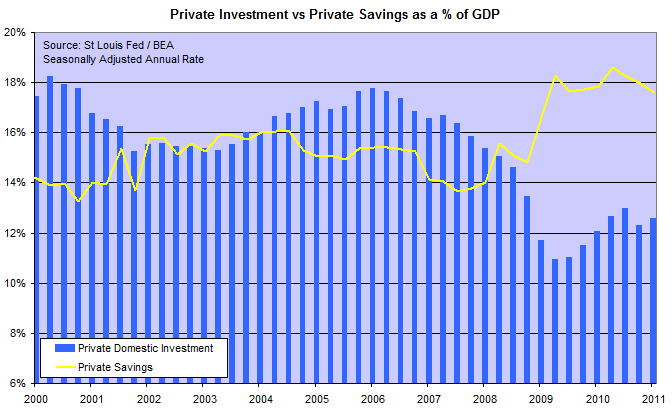
Figures to the end of the first quarter show a persistent gap between private savings and investment, with the excess being applied to reduce private debt.
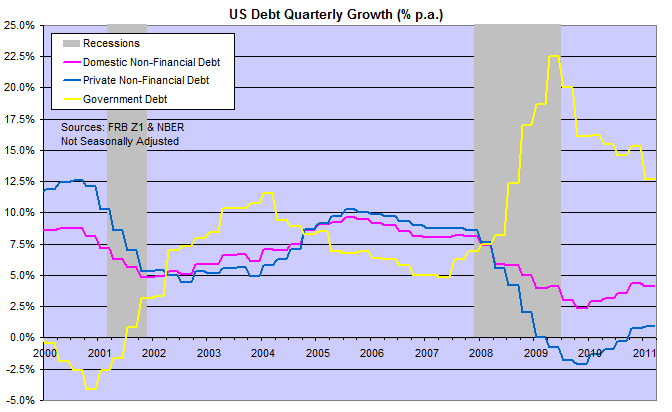
.... resulting in a sharp spike in government borrowing in order to prevent a deflationary spiral.
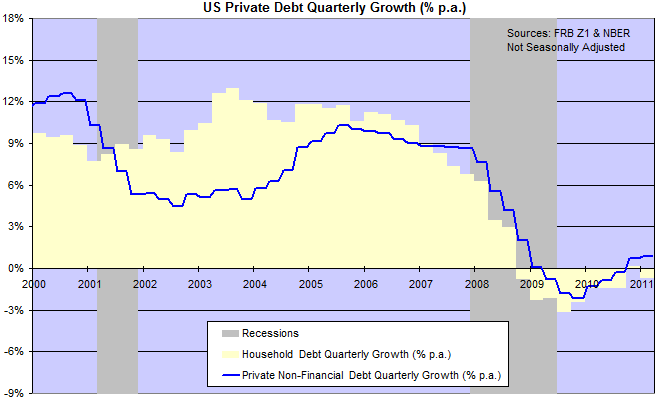
There is no evidence of an economic recovery yet, with little growth in corporate debt and household debt once again shrinking.
United Kingdom
In the UK, advances to the household sector are contracting.
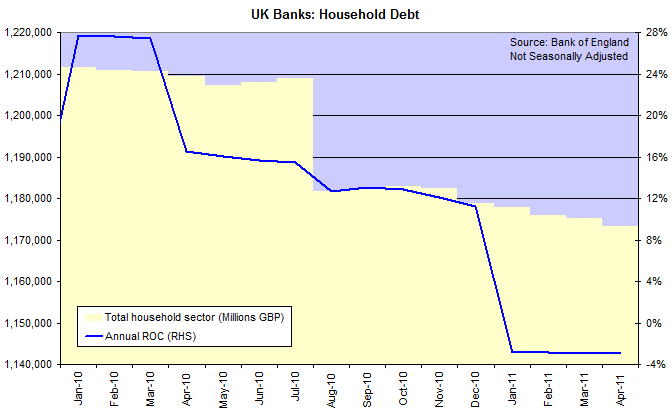
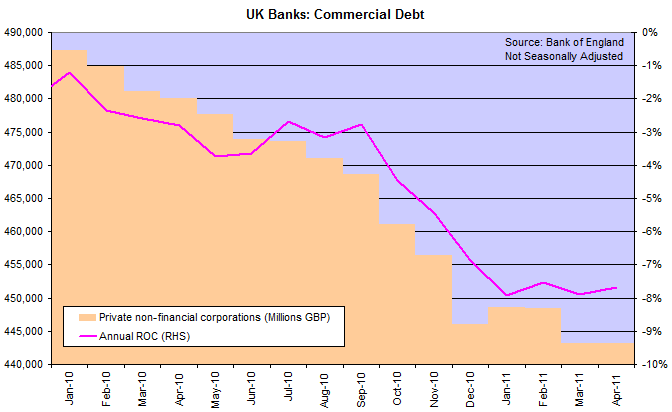
But nowhere near as fast as the commercial sector where annual shrinkage of close to 8% is cause for concern.
China
Consumer inflation figures rose to 5.5% in May, prompting the central bank to raise bank reserve ratios by another 0.5%, the ninth such increase since October last year [Reuters]. Major banks are now required to set aside 21.5% of deposits as liquid reserves. Raising reserve requirements is not as direct as raising interest rates but has the same eventual outcome: restricting supply of credit creates upward pressure on rates.
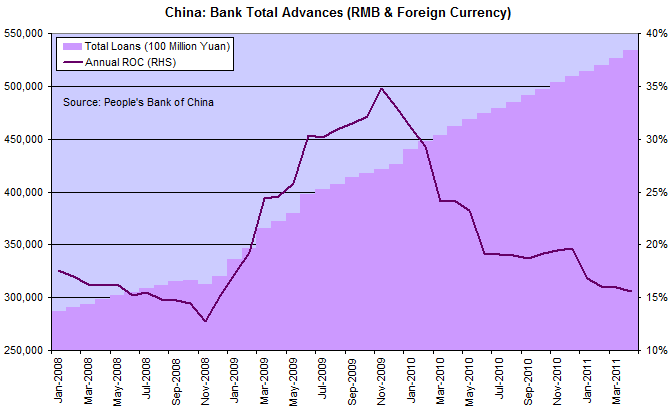
The PBC will struggle to contain the inflation hangover after their massive credit surge in 2009 and further tightening is expected.
Australia
Australian banks continue to expand credit to households, but the rate of expansion has slowed markedly since 2008. The debt bubble continues to build, however, making further rate rises inevitable.
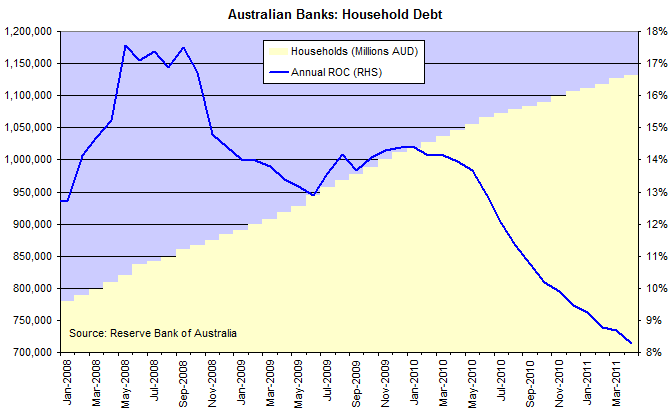
Advances to the commercial sector, meanwhile, have been contracting since early 2009.
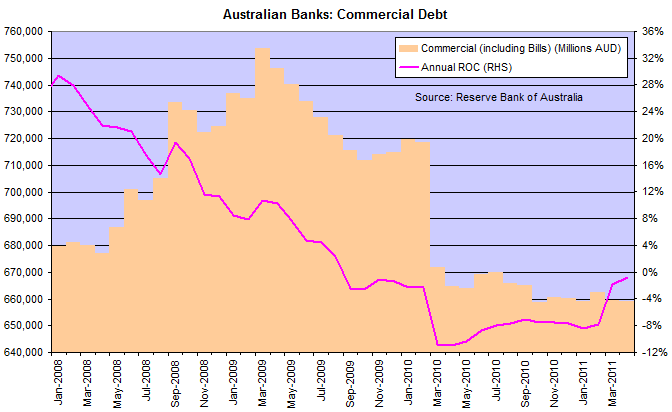
Capital investment continues in the resources sector, but may slow if China remains committed to its goal of taming inflation.
Conclusion
The sharp contraction in commercial debt in the UK is cause for concern, reflecting a lack of new investment. US corporate (non-financial) debt is recovering slightly but the household sector continues to shrink. The Australian resources boom continues but is offset to some extent by contraction in other sectors of the economy.
China remains positive but is likely to struggle with inflation as a result of its massive credit expansion after the GFC. The overall outlook remains weak, with low growth ahead.
Neglecting the benefits of using resources more productively misses one of the main economic lessons of the past half century. Transfers, grants and redistribution did little to raise living standards in Asia, Latin America and Africa. Capitalist development and open economies lifted vastly more people out of poverty in a decade than welfare state policies had achieved in 50 years..... After one generation, a one percentage point difference in growth rate becomes a 25% difference in per-capita income.
~
Allan H Meltzer professor of public policy at the Tepper School, Carnegie Mellon University

Author: Colin Twiggs is a former investment banker with almost 40 years of experience in financial markets. He co-founded Incredible Charts and writes the popular Trading Diary and Patient Investor newsletters.
Using a top-down approach, Colin identifies key macro trends in the global economy before evaluating selected opportunities using a combination of fundamental and technical analysis.
Focusing on interest rates and financial market liquidity as primary drivers of the economic cycle, he warned of the 2008/2009 and 2020 bear markets well ahead of actual events.
He founded PVT Capital (AFSL No. 546090) in May 2023, which offers investment strategy and advice to wholesale clients.
