Crude spike warns of trouble ahead
By Colin Twiggs
May 25th, 2011 11:00 p.m. ET (1:00 p:m AET)
These extracts from my trading diary are for educational purposes and should not be interpreted as investment or trading advice. Full terms and conditions can be found at Terms of Use.
We discussed last week how copper and tin have commenced a primary down-trend. Murray, a regular reader, wrote to remind me of the similarity to the 1980-81 commodities boom and the 1981-83 recession that followed.
The chart below compares crude oil and the CRB index to recessions recorded by the NBER. Every recession since 1970 has been preceded by a spike in commodity and/or crude oil prices. More importantly, every spike in crude oil prices is followed by a recession. The current spike is unlikely to prove any different.
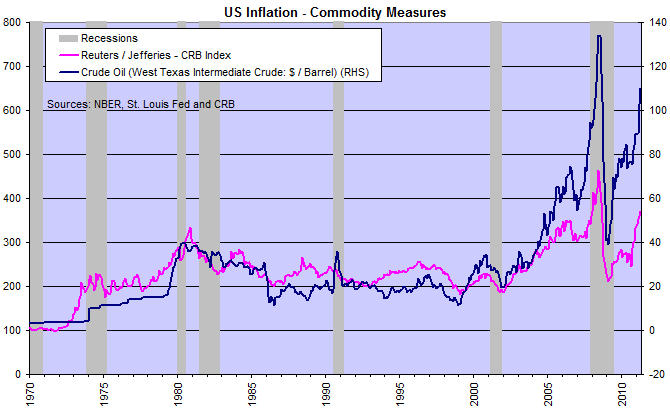
Conflict in Libya exacerbated the current situation, but initial groundwork for high oil prices was laid by the Fed and QEII.
US Dollar Index
The Dollar index respected resistance at 76, indicating continuation of the primary down-trend. A re-test of support at 73 is likely, while recovery above 76 would warn that the down-trend is losing momentum.
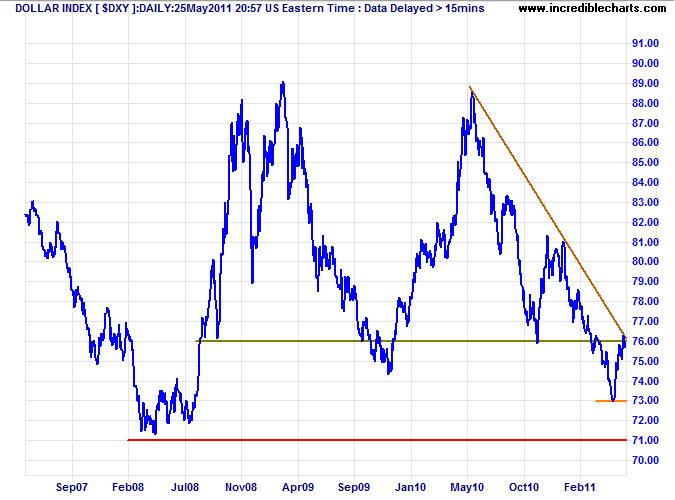
* Target calculation: 76 - ( 81 - 76 ) = 71
Gold
Gold recovered above $1520, signaling the end of its "correction". Follow-through above Wednesday's candle would confirm. Reversal below $1520 is less likely, but breach of the medium-term trendline would warn of a bull trap — and a test of the long-term trendline around $1400. Behavior of the dollar will be a major influence.
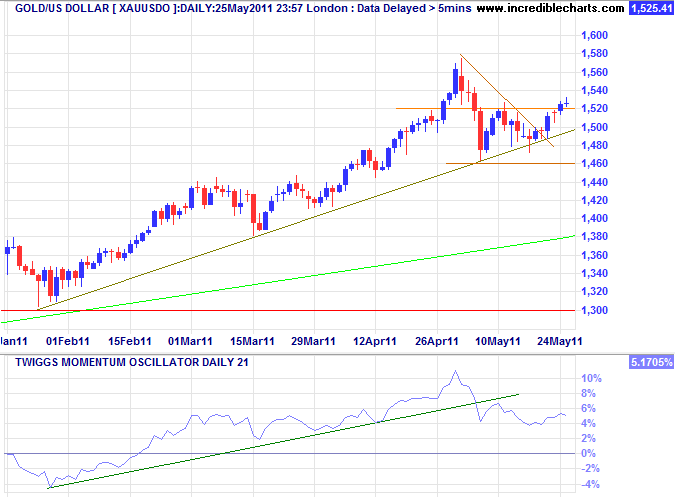
* Target calculation: 1430 + ( 1430 - 1310 ) = 1550
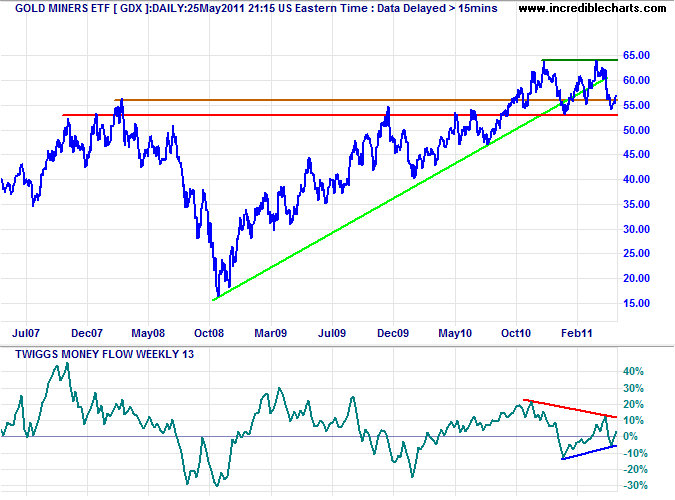
The Gold Miners ETF continues to range between 6400 and support at 5300. Breakout from the range would signal future direction, but bearish divergence on 13-week Twiggs Money Flow warns of selling pressure. Gold miners often lead the physical metal.
Silver
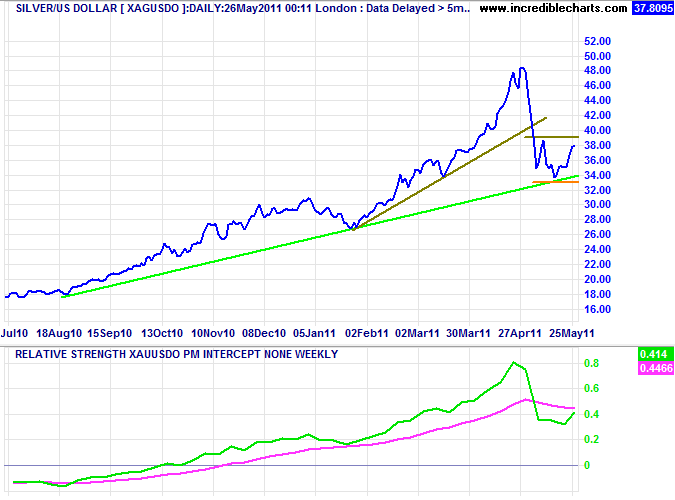
Silver found medium-term support at $33 before rallying to test resistance at $39. Consolidation between $33 and $39 is likely and would establish a new base. Relative Strength shows that despite the crash silver still out-performed gold over the last 12 months.
Commodities
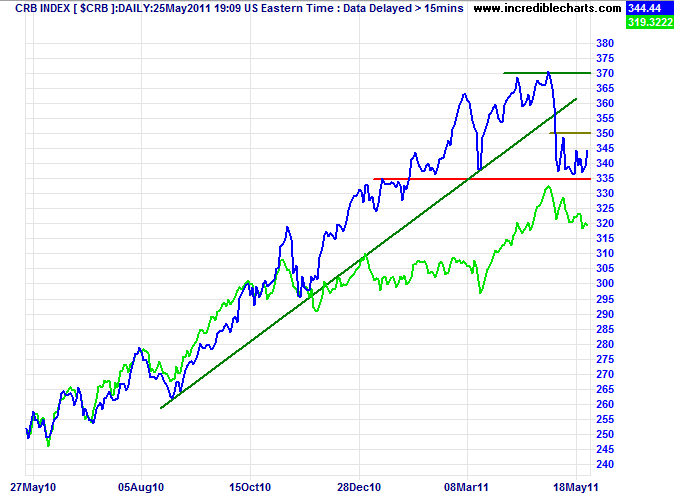
The CRB Commodities Index is consolidating between 335 and 350. Breakout would indicate future direction. Again, the dollar will have a strong influence.
Crude Oil
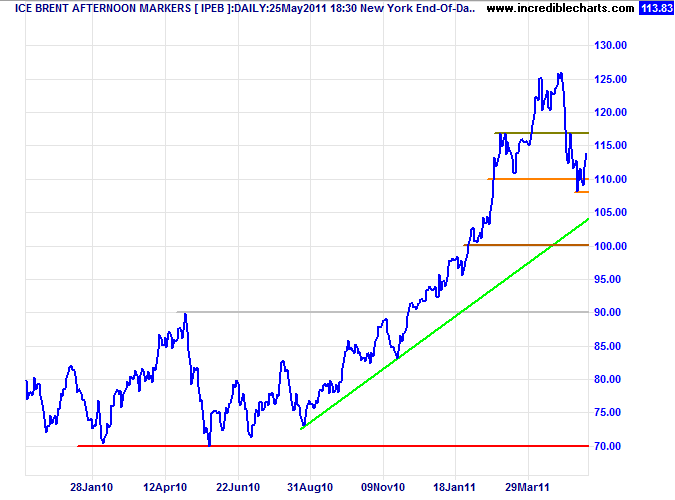
Brent crude similarly found medium-term support at $110/barrel. Failure would indicate a test of the long-term trendline around $100/barrel, while recovery above $117 would signal a fresh advance.
Euro
The euro followed through below $1.41, confirming a correction to the long-term trendline.
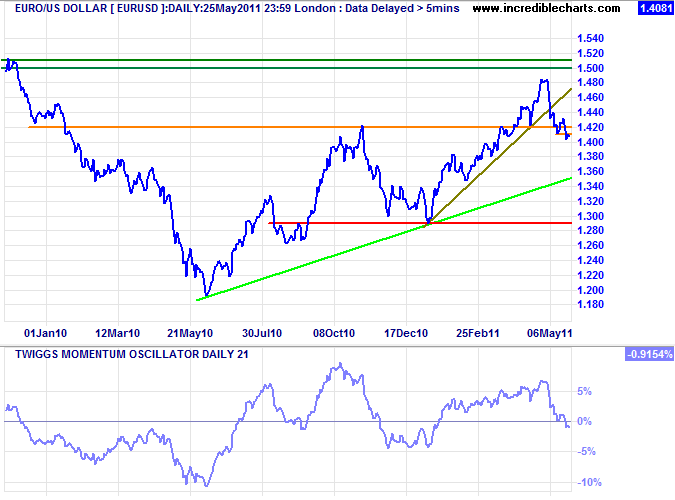
* Target calculation: 1.40 + ( 1.40 - 1.30 ) = 1.50
UK Pound Sterling
The pound respected support at $1.60. Recovery above $1.64 would signal a fresh advance. Reversal below $1.60 is now unlikely, but would test primary support at $1.53. Penetration of the long-term trendline would also warn that the up-trend is weakening. Twiggs Momentum oscillating above zero, however, continues to reflect an up-trend.
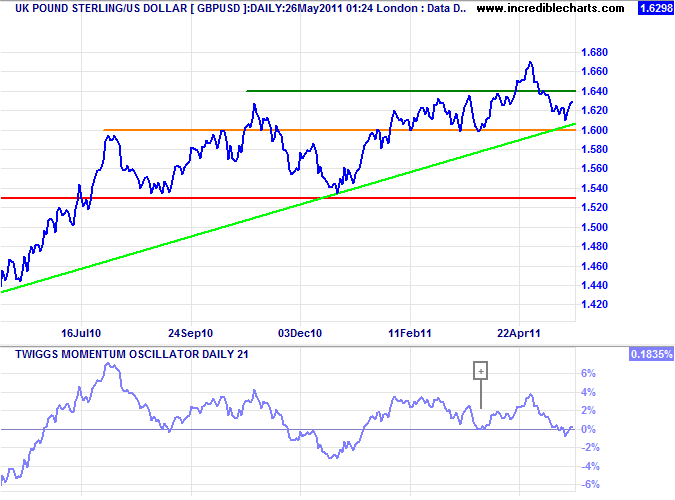
* Target calculation: 1.63 + ( 1.63 - 1.53 ) = 1.73
Japanese Yen
The dollar continues to test long-term support between ¥79 and ¥80. Failure would signal a down-swing to ¥75*.
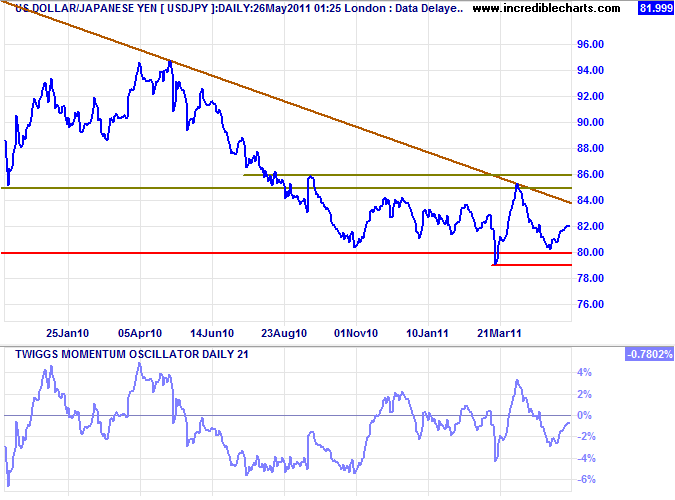
* Target calculation: 80 - ( 85 - 80 ) = 75;
New Zealand Dollar
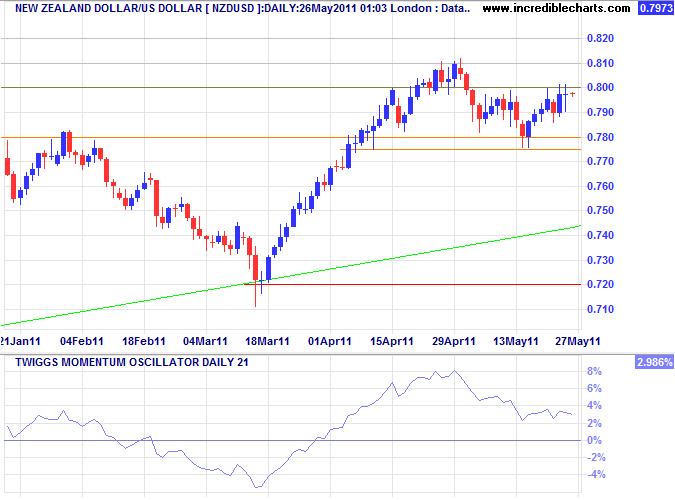
The kiwi dollar found medium-term support against the greenback around $0.78, before rallying to test resistance at $0.80. Breakout would target the 2008 high at $0.82.
Australian Dollar
The Aussie dollar is undergoing a mild correction against the greenback. Breakout below $1.05 would test medium-term support at $1.02. Recovery above $1.07 is less likely, given the weakness of commodities, but would signal another test of $1.10*.
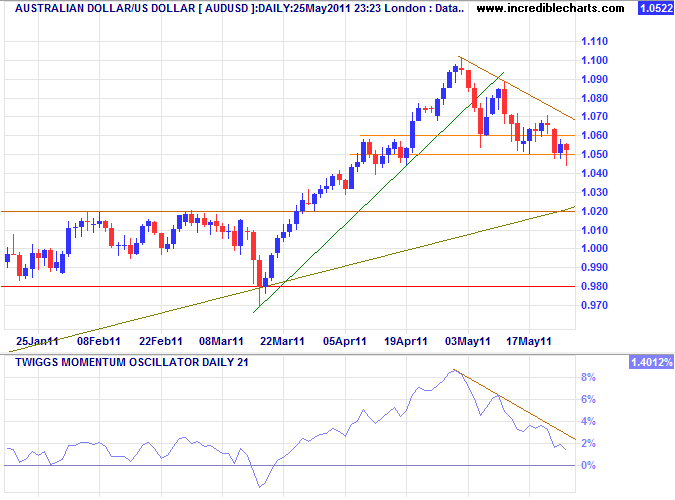
* Target calculation: 1.10 + ( 1.10 - 1.05 ) = 1.15
A down-hill skier needs to turn more than their head in order to change direction; turning their head only moves the rocks out of view.
~ with thanks to Ehmu on the forum.

Author: Colin Twiggs is a former investment banker with almost 40 years of experience in financial markets. He co-founded Incredible Charts and writes the popular Trading Diary and Patient Investor newsletters.
Using a top-down approach, Colin identifies key macro trends in the global economy before evaluating selected opportunities using a combination of fundamental and technical analysis.
Focusing on interest rates and financial market liquidity as primary drivers of the economic cycle, he warned of the 2008/2009 and 2020 bear markets well ahead of actual events.
He founded PVT Capital (AFSL No. 546090) in May 2023, which offers investment strategy and advice to wholesale clients.
