What's New: Stop Losses — Help or Hindrance?
[Part 3 in a series of 3 articles]
May 7th, 2011 3:00 a.m. ET (5:00 p.m. AET)
This newsletter is subject to Incredible Charts Terms of Use.
Introduction
This article is part 3 in a 3-part series on stop losses. In this article, I will introduce the Monte-Carlo technique and show how we can use it to increase our knowledge of the behavior of the different types of stops tested in this series.
Monte-Carlo Analysis
By definition a portfolio is a subset of the raw trades signalled by the entry and exit rules. The most common reason that a portfolio usually has less trades than the total possible relates to the way the trader/investor manages money, and that is why it is important to test a portfolio with a specific amount of capital. Different amounts of capital (and money management approaches) can give rise to different possible portfolios.
Consider a trader/investor who invests his/her money in multiples of $10,000 according to the above buy/sell rules. What will the trader/investor do if 2 stocks are signalled on the same day, yet the trader/investor only has $10,000 left? Clearly, only 1 trade can be taken, but which one?
It may well be that over time the two trades have very different outcomes. For example, one goes up, and one goes down!
When running a portfolio, the issue of having more trading opportunities than money can occur reasonably frequently, particularly in a trend-trading approach. Again, in the above example, what will the trader/investor do on the next day, when yet another trade is signalled, and there is no money left to take it. Of course, it must be skipped from the portfolio.
To fully understand the implications of taking and skipping certain trades, quantitative analysts may resort to Monte-Carlo modeling, which allows us to build a probability outcome of all the possible portfolios which could have been built dependent on the decisions the trader/investor took.
As an example, in an earlier paragraph we wondered how to model the portfolio outcome when there were two possible trading candidates but only enough money to take 1 trade. The solution using computational mathematical methods is that from this point forward, there are now two theoretical portfolios � one with each possible stock in it. Following on from this logic, you can see that over a period of time, there could actually be a great number of possible portfolios, all dependent on the decisions taken by the individual trader/investor. All of these portfolios would be real possible outcomes, totally dependent on the choices made by the trader/investor on a day to day basis!
To assess the impact of stops completely, we need to consider not just one simulated portfolio outcome (as we did earlier), but a large number of the possible theoretical outcomes. We can approach this using the Monte-Carlo methodology, and determine the probability of various return and drawdown outcomes.
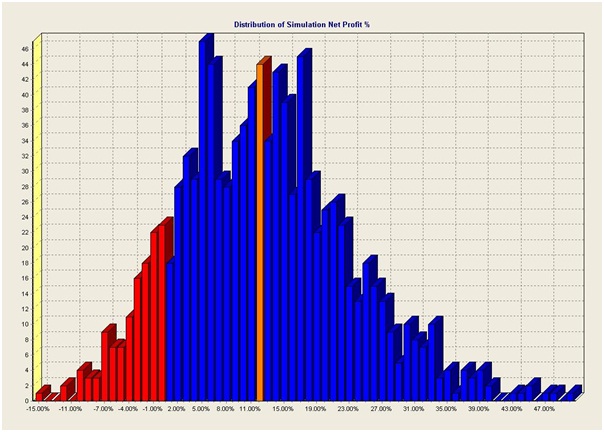
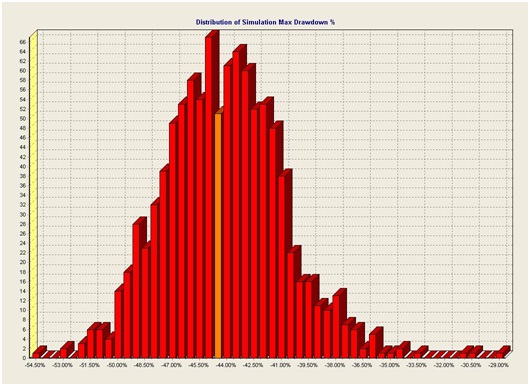
The following figures show the probability distributions for the Raw Return (aka Net Profit) and the Maximum Drawdown metrics for 1000 of the possible 'NO STOP LOSS' portfolios. These provide the benchmark for this final piece of analysis. Under each figure, I have also included the smallest, average and largest values obtained from the 1000 simulations.

Smallest =-17.32%, Average = 11.66%, Largest = 43.82%

Smallest = -30.00%, Average = -44.44%, Largest = -53.21%
Outcomes
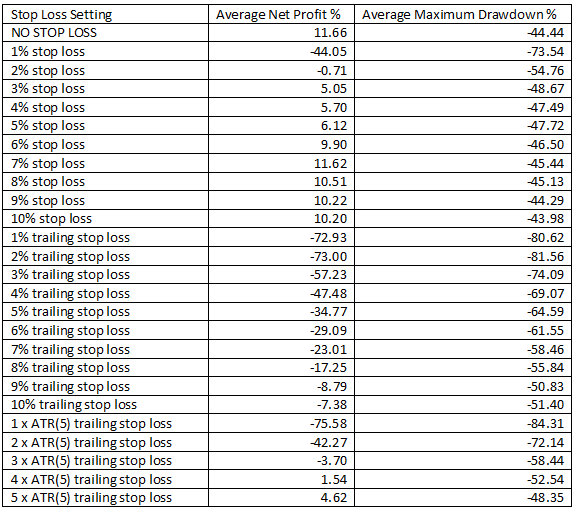
The following table shows the average values for both the Net Profit % (not the APR%), and the Maximum Drawdown % for 1000 possible portfolios for each of the 25 stop combinations tested.

Implications
From inspection of this table, we can see that there was no set of 1000 possible portfolios more profitable than the 'NO STOP LOSS' combinations. We can also see the ATR based stop methods have performed quite poorly compared to nearly all of the simple percentage based stop methods. In summary, no combination of stops was able to improve on the basic strategy without stops.
Conclusion
Some traders appear to use stops to provide a level of comfort about the risk they take with their trading. If you feel you absolutely cannot live without stops, even after performing similar tests to these on your own system, you must, of course, continue using them. Perhaps you could even consider simply making them wider.
However, many traders and investors appear to view the stop loss order as a panacea. These empirical results show that the stop loss order may actually be contributing to the poor performance of some traders, and may even be the cause of their lower than expected returns.
One of the reasons that this behavior may be occurring is that many stops are being hit at the same time. This is more likely due to changes in the overall market rather than having any specific relationship to changes in some particular company share price.
I have seen similar results in the past when testing stop orders against long-only, equity based, trend-following types of systems.
If your trading style is best described by phrases like "long-only", "equity based", and "trend-following", and you use stop-loss orders, then you may wish to consider testing your trading rules to see if the stops are actually helping or hindering your performance. You can follow the procedure outlined in this series of articles, and in my book, Designing Stockmarket Trading Systems (with and without soft computing), to help you do this.
Forum Discussion
We hope you find this series of articles interesting. There is a thread on the forum where readers can contribute their views: Do Stop Losses Really Work?
Regards,
Colin Twiggs
Look at market fluctuations as your friend rather than your enemy; profit from folly rather than participate in it.
~ Warren Buffett.

Author: Colin Twiggs is a former investment banker with almost 40 years of experience in financial markets. He co-founded Incredible Charts and writes the popular Trading Diary and Patient Investor newsletters.
Using a top-down approach, Colin identifies key macro trends in the global economy before evaluating selected opportunities using a combination of fundamental and technical analysis.
Focusing on interest rates and financial market liquidity as primary drivers of the economic cycle, he warned of the 2008/2009 and 2020 bear markets well ahead of actual events.
He founded PVT Capital (AFSL No. 546090) in May 2023, which offers investment strategy and advice to wholesale clients.
