What's New: Stop Losses - Help or Hindrance?
[Part 2 in a series of 3 articles]
April 19, 2011 2:00 p.m. ET (4:00 a.m. AET)
This newsletter is subject to Incredible Charts Terms of Use.
Introduction
This article is part 2 of a 3 part-series on stops. In this article, I continue testing and benchmarking the original EMA crossover strategy by adding in percentage-based and ATR-based trailing stops.
Trailing Percentage Stops
Many traders and brokers use an initial percentage stop and a trailing percentage stop to manage their positions. As an example, a trader might say, "I will set a stop loss 5% below my entry price, and then trail it 5% below the previous days closing price as the trade progresses". Here, we test this method using percentage thresholds from 1% - 10% in steps of 1, for all the trades generated by the ema crossover rules.
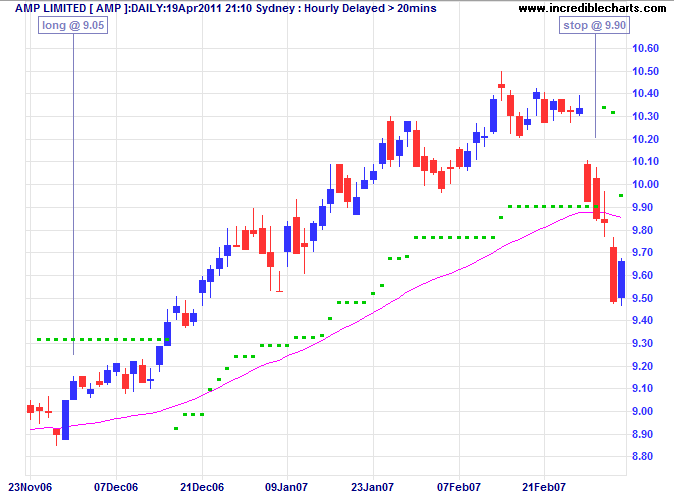
An example is shown in Figure 2. The green dots show the position of the percentage-based trailing stop, and the pink line shows the value of the EMA(60).

Figure 2: Percentage trailing stop (5%) used for controlling the stop loss price
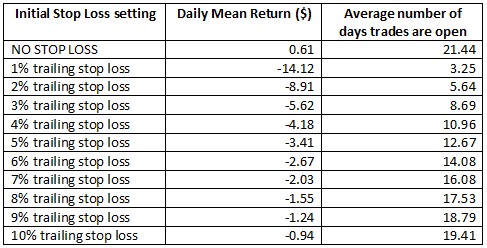
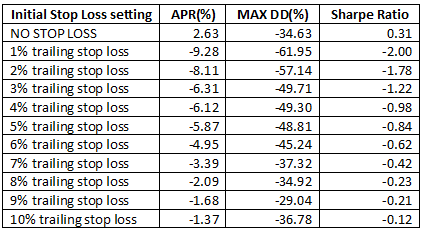
The impact that these percentage trailing stops have on both return and risk is presented next.
Raw Trades

From the table presented, it is clear that none of the stop methods tested improved the 'NO STOP LOSS' portfolio's daily mean return. This is as expected, given that, by definition, an initial stop loss rule entails selling at a loss. To determine whether this approach has decreased our risk, we next test within a portfolio setting.
Portfolio

From this table, we can see that none of the stop methods have improved the 'NO STOP LOSS' portfolio's APR. Further, none of the stop loss settings was able to improve the Sharpe Ratio. Again, all combinations of stop loss tested achieved less return, and were riskier.
Implications
To statistically compare the portfolio results, we can use the ANOVA procedure, which allows us to simultaneously compare all the trades generated under the 'NO STOP LOSS' condition, with all the sets of trade possibilities from the 10 stop loss combinations. This allows us to determine whether there is any statistical significance in our findings.
The results indicate that no benefit has been obtained from any of the stop combinations. I have purposefully omitted a detailed explanation of using the ANOVA procedure in this article, to allow us to keep focused on the effects of stop losses. As mentioned earlier, those readers interested in pursuing the benchmarking of trading systems using statistical methods can find all the details in my book, Designing Stockmarket Trading Systems (with and without soft computing).
ATR-based Stops
Many traders simply use a multiple of the ATR (Average True Range) to determine their stop level price. As an example, a trader might say, "I will set a stop loss 2 times the 5-day ATR below my entry price". To demonstrate the versatility of this technique, I have implemented this as both an initial ATR stop, and then allowed it to become a trailing stop as the trade moves into profit. This is typical of the way many retail traders manage their ATR based stops.
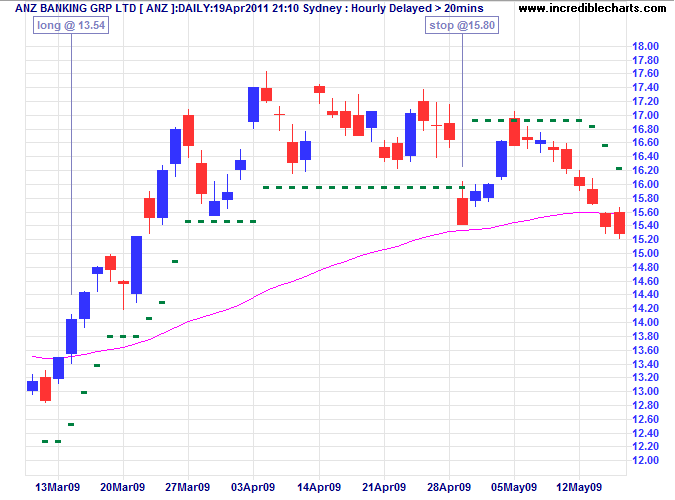
An example is shown in Figure 3. The green dots show the position of the ATR-based trailing stop, and the pink line shows the value of the EMA(60).

Figure 3: ATR stop (2 x ATR(5)) used for controlling the stop loss price
The impact that these initial stops have on both return and risk is presented next.
Raw Trades

From the table presented, it is clear that none of the stop methods tested improved the portfolio's return. This is as expected, given that, by definition, an initial stop loss rule entails selling at a loss. To determine whether this approach has decreased our risk, we next test within a portfolio setting.
Portfolio

From this table, we can see that none of the stop methods have improved the 'NO STOP LOSS' portfolio's APR. Further, none of the stop loss settings was able to improve the Sharpe Ratio. Again, all combinations of stop loss tested achieved less return, and were riskier.
Implications
Again we can use the ANOVA procedure to determine the statistical significance of these results. The results indicate that no benefit has been obtained from any of the stop combinations tested.
Summary
In this article, I have continued testing different types of stops to see if they can improve the original EMA crossover strategy. This time I have tested percentage-based trailing stops, and ATR-based trailing stops. It was found that all stops tested increased the risk and reduced the return of the original strategy.
In the next article, I will demonstrate the Monte-Carlo technique and show how it can provide additional insights into the use of stops.
Forum Discussion
We hope you find this series of articles interesting. I have opened a thread on the forum for readers to contribute their views: Do Stop Losses Really Work?
Regards,
Colin Twiggs
You're neither right nor wrong because other people agree with you. You're right because your facts are right and your reasoning is right — and that's the only thing that makes you right. And if your facts and reasoning are right, you don't have to worry about anybody else.
~ Warren Buffett.

Author: Colin Twiggs is a former investment banker with almost 40 years of experience in financial markets. He co-founded Incredible Charts and writes the popular Trading Diary and Patient Investor newsletters.
Using a top-down approach, Colin identifies key macro trends in the global economy before evaluating selected opportunities using a combination of fundamental and technical analysis.
Focusing on interest rates and financial market liquidity as primary drivers of the economic cycle, he warned of the 2008/2009 and 2020 bear markets well ahead of actual events.
He founded PVT Capital (AFSL No. 546090) in May 2023, which offers investment strategy and advice to wholesale clients.
