Tech lift-off
By Colin Twiggs
October 18, 2010 5:00 a.m. ET (8:00 p.m. AEDT)
These extracts from my trading diary are for educational purposes and should not be interpreted as investment or trading advice. Full terms and conditions can be found at Terms of Use.
Fears of an October correction have faded after the Fed made clear its intention to inject further money if jobs numbers remain weak. European, Asian and North American markets are all advancing, with the NASDAQ and DAX making new 2010 highs. Bearish divergences warn of short/medium-term selling pressure in the UK, India, Japan and Australia, but the overall mood is bullish.
The Dow Global index ($DJWO) encountered resistance at its April high at 242. Narrow consolidation would indicate a breakout, but bearish divergence on Twiggs Money Flow (21-day) warns of a correction. Upward breakout would signal a long-term advance to 280*.
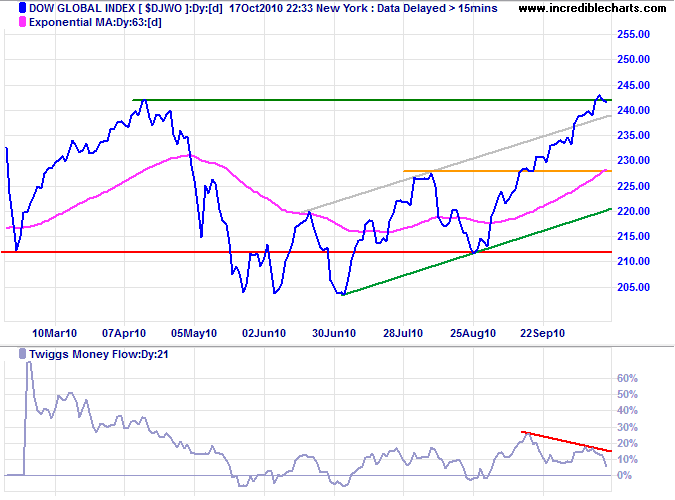
* Target calculations: 242 + ( 242 - 204 ) = 280
USA
Dow Jones Industrial Average
The Dow is testing its April high of 11200. Narrow consolidation below resistance would indicate a breakout. Twiggs Money Flow (21-day) oscillating above the zero line signals buying pressure. Breakout above 11200 would offer a long-term target of 12700*.
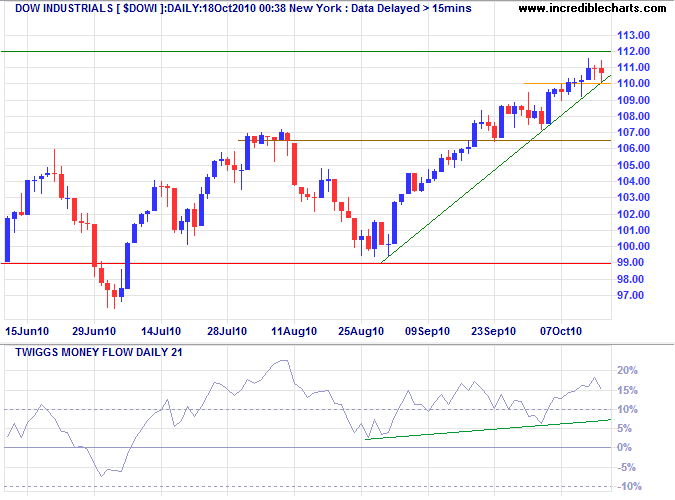
* Target calculations: 11200 + ( 11200 - 9700 ) = 12700
S&P 500
The S&P 500 broke through its upper trend channel, advancing toward the April high of 1220. A strong rise on Twiggs Money Flow (13-week) signals buying pressure. Breakout above 1220 would offer a long-term target of 1420*.
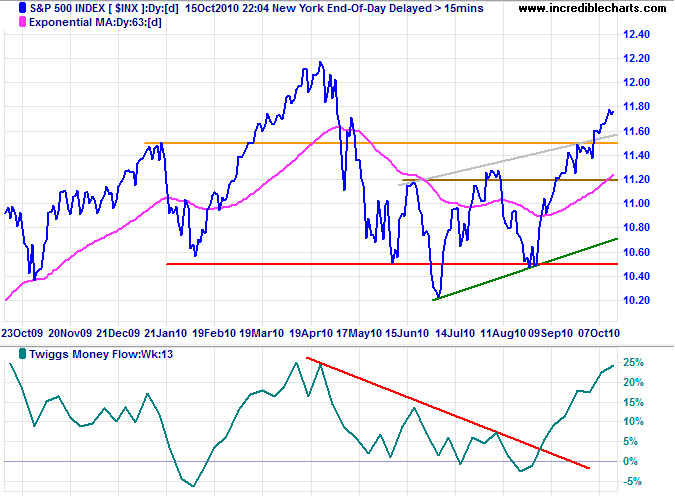
* Target calculation: 1220 + ( 1220 - 1020 ) = 1420
Transport
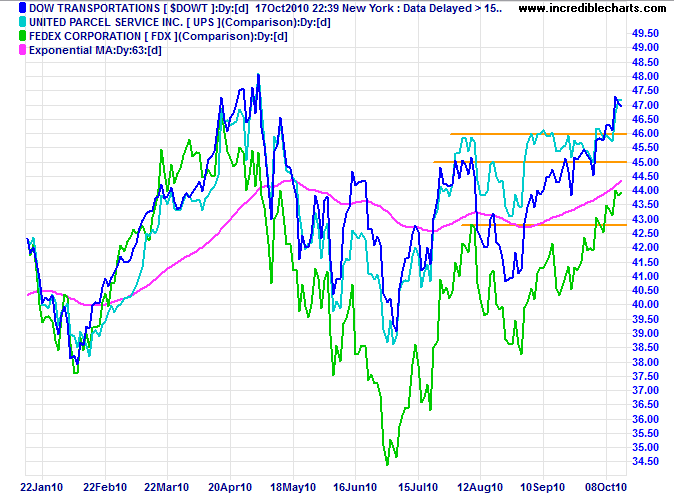
The Dow Transport index and bellwether stocks Fedex and UPS all broke above their August highs to signal a primary up-trend. A bullish sign for the broader economy.
Technology
Tech stocks are leading the charge, with the Nasdaq 100 breaking resistance at 2060 to signal an advance to the 2007 high of 2250*. The strong rise on Twiggs Money Flow (13-week) signals buying pressure.
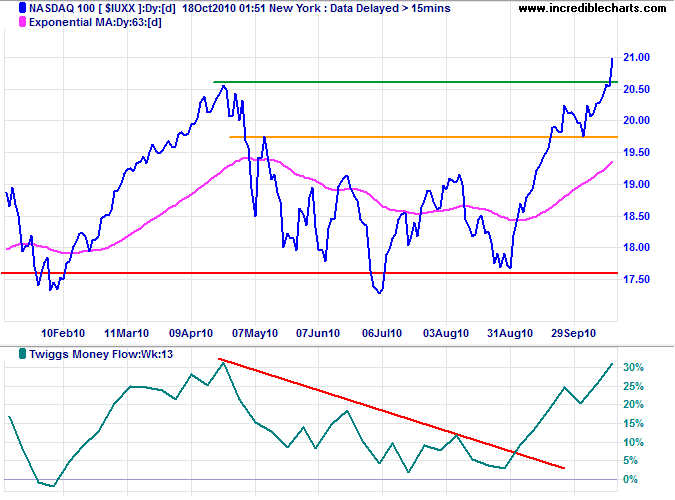
* Target calculation: 2050 + ( 2050 - 1750 ) = 2350
Canada: TSX
TSX Composite is in a primary advance to 13400*, but retracement to test the new support level at 12300 remains likely. A 21-day Twiggs Momentum reversal below its rising trendline would warn of a correction, while a trough that respects the zero line would confirm the up-trend.
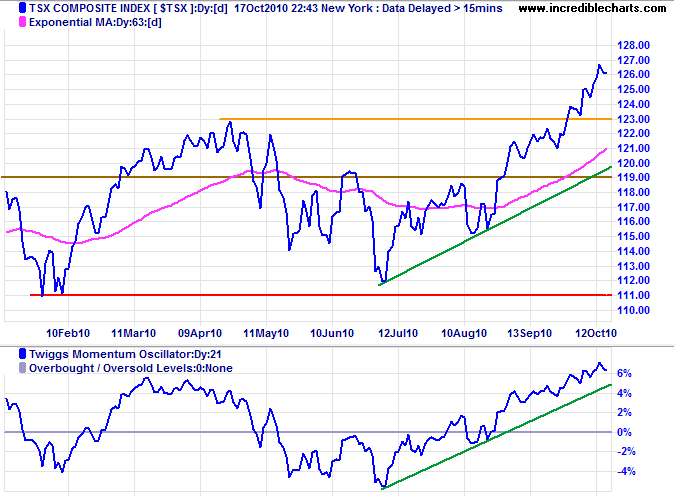
* Target calculation: 12300 + ( 12300 - 11200 ) = 13400
United Kingdom: FTSE
The FTSE 100 is headed for a test of its April high at 5850*. Breakout would offer a long-term target of the 2007 high at 6750*. Bearish divergence on Twiggs Money Flow (21-day), however, warns of short/medium-term selling pressure.
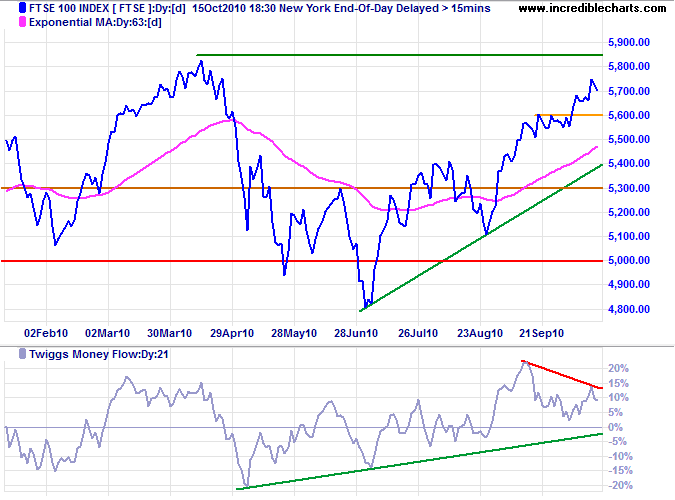
* Target calculation: 5800 + ( 5800 - 4800 ) = 6800
Germany: DAX
The DAX broke through resistance at 6350, signaling a primary advance. The long-term target is 6900*. Rising Twiggs Money Flow (13-week) indicates short/medium-term buying pressure. Expect retracement to test the new support level.
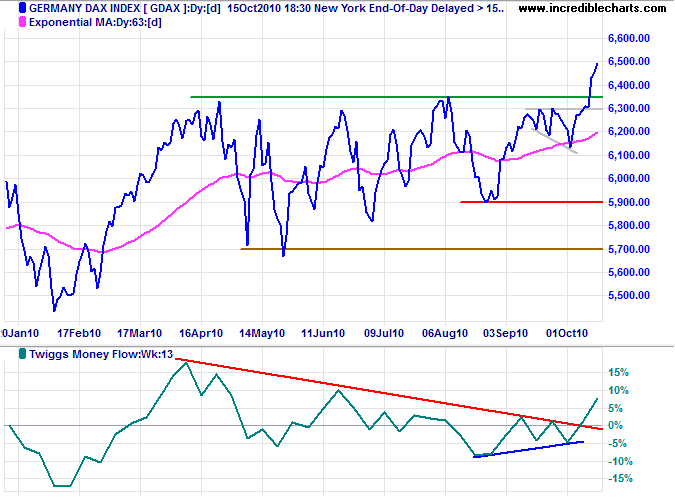
* Target calculation: 6300 + ( 6300 - 5700 ) = 6900
France: CAC-40
The CAC-40 also broke through resistance (at 3800), but not as convincingly as the DAX. Expect an advance to the April high of 4050. Twiggs Money Flow (13-week) rising above the zero line indicates moderate buying pressure. Reversal below 3650 would signal another test of primary support at 3450.
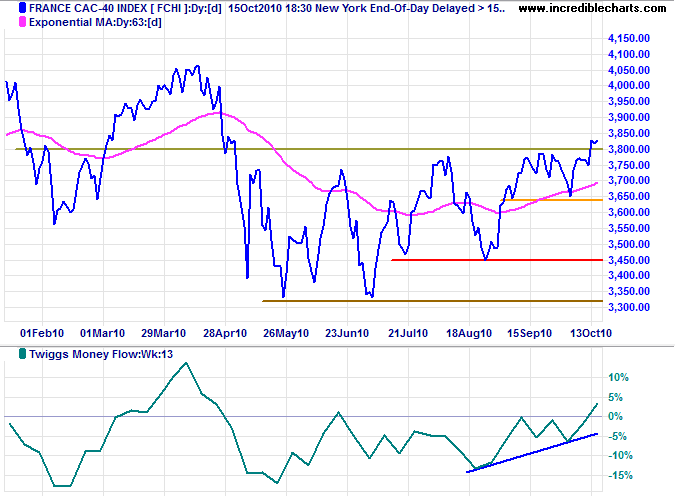
* Target calculation: 3750 + ( 3750 - 3450 ) = 4050
India
The Sensex is retracing to test the new support level at 20000. A sharp down-turn on Twiggs Money Flow (13-week) indicates short-term selling pressure. Failure of support would warn of a correction to the rising trendline.
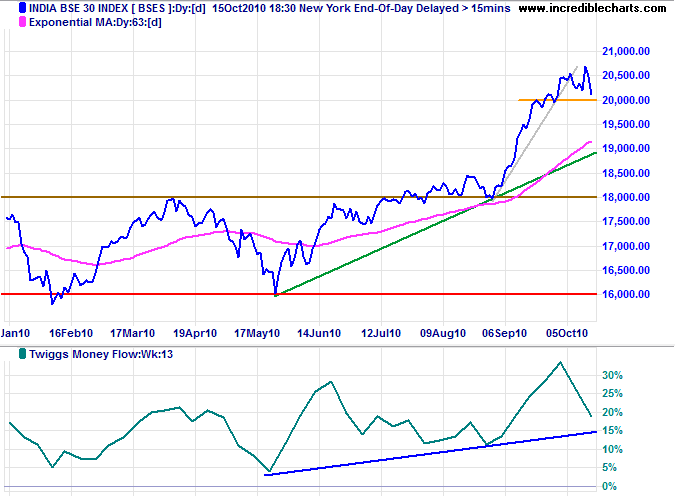
* Target calculation: 18000 + ( 18000 - 16000 ) = 20000
Singapore
The Straits Times index is advancing towards its target of 3350*. Reversal of 21-day Twiggs Momentum below its rising trendline would warn of a correction, while a trough that respects the zero line would confirm the strong up-trend.
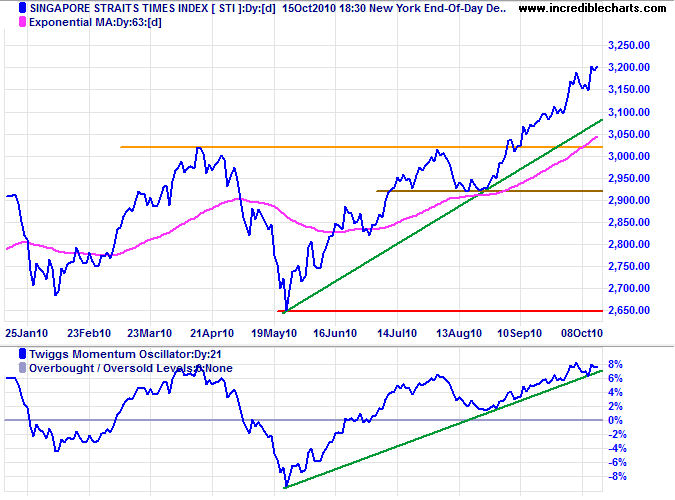
* Target calculation: 3000 + ( 3000 - 2650 ) = 3350
Japan
The Nikkei 225 is again testing medium-term support at 9400. Bearish divergence on Twiggs Money Flow (21-day) warns of selling pressure. Failure of support would test primary support at 8800. Breakout above 9800 is unlikely, but would signal an advance to 10200.
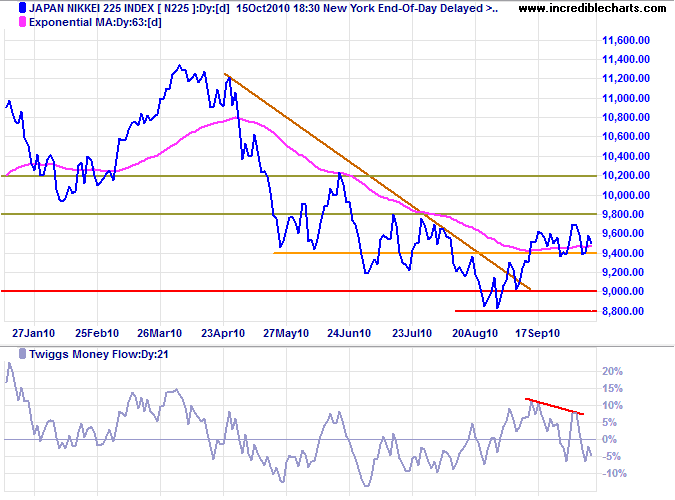
* Target calculation: 9000 - ( 11000 - 9000 ) = 7000
South Korea
The Seoul Composite index encountered short-term resistance at 1900, but Twiggs Money Flow (13-week) indicates strong buying pressure. Target for the primary advance is 1950*.
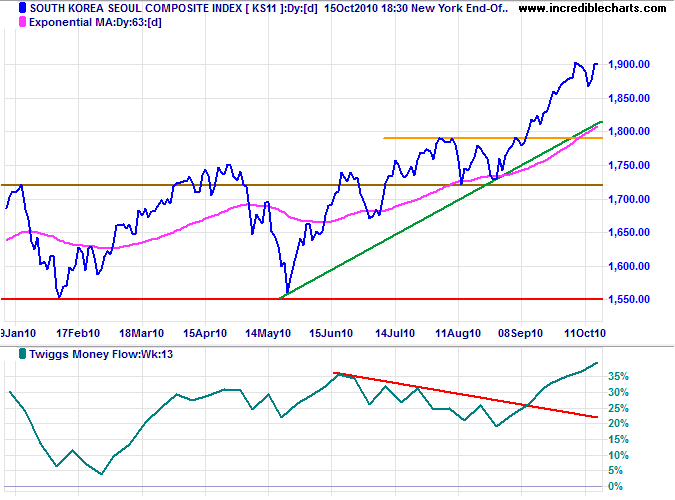
* Target calculation: 1750 + ( 1750 - 1550 ) = 1950
China
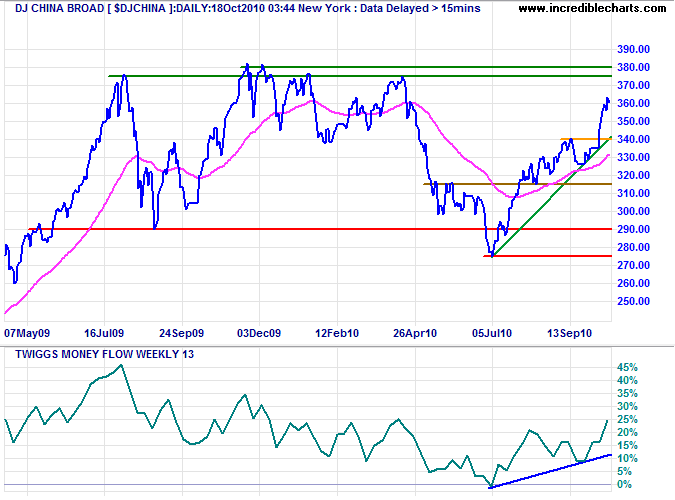
The DJ China index is headed for a test of resistance at 380. Rising Twiggs Money Flow (13-week) signals strong buying pressure, but expect significant resistance at the 2009 high. Reversal below the rising trendline is unlikely, but would warn of another correction.
The HangSeng Index broke through its 2009 high of 23000. Rising Twiggs Money Flow (13-week) indicates continued buying pressure. Expect retracement, however, to test the new support level.
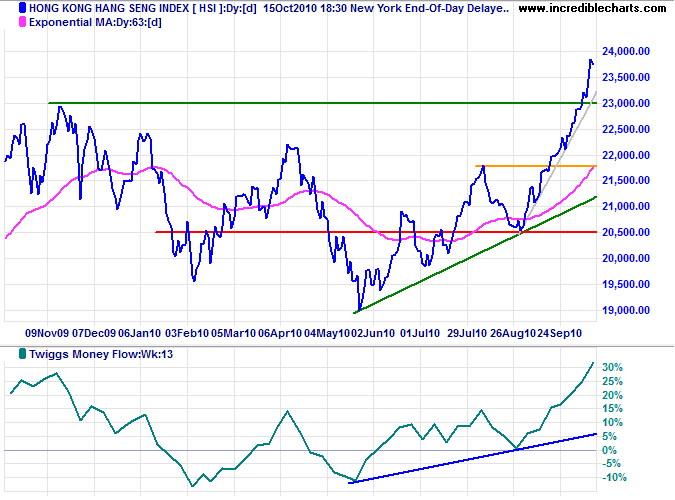
* Target calculations: 21800 + ( 21800 - 20600 ) = 23000
Brazil
The Bovespa index is testing its April high at 72000. Twiggs Money Flow (13-week) holding above zero signals buying pressure. Reversal below 70000 is unlikely at present, but would warn of a correction. Breakout above 72000 would test the 2008 high of 73500/74000.
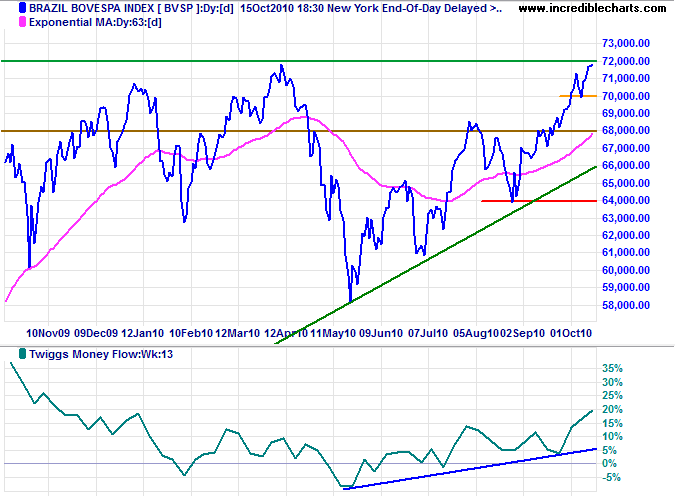
* Target calculation: 70000 + ( 70000 - 60000 ) = 80000
Australia: ASX
The All Ordinaries continues in a broadening wedge consolidation above the new support level at 4620; upward breakout would signal an advance to 5000*. Bearish divergence on Twiggs Money Flow (21-day), however, warns of selling pressure. Reversal below 4620 would signal another correction.
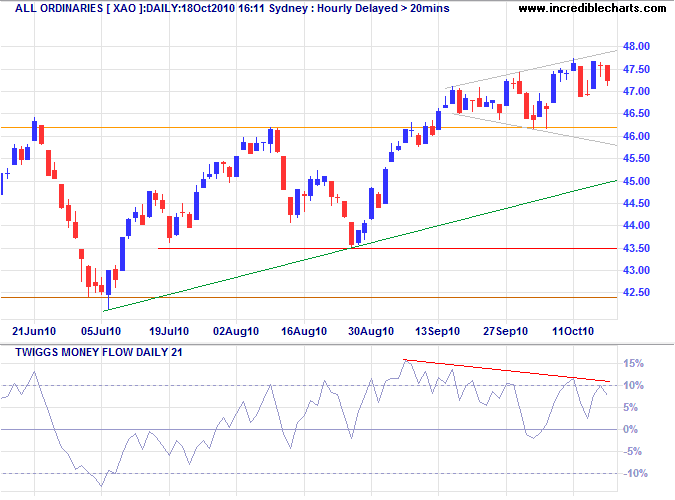
* Target calculation: 4650 + ( 4650 - 4250 ) = 5050
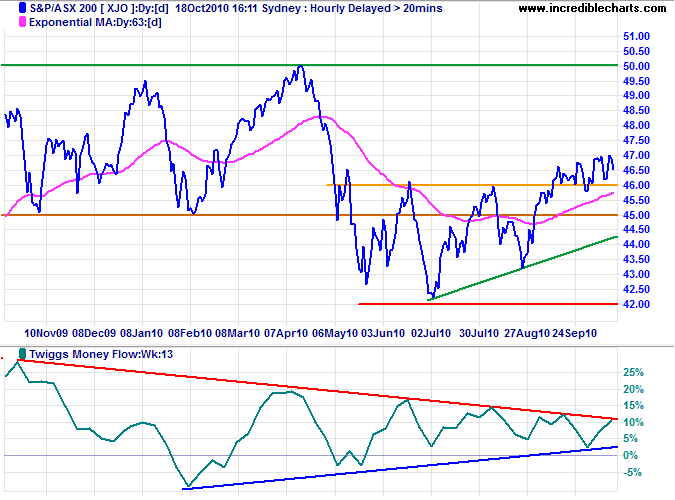
The ASX200 displays a large triangle on Twiggs Money Flow (13-week); respect of the zero line indicates that upward breakout is more likely.
We all want progress, but if you're on the wrong road, progress means doing an about-turn ...... in that case, the man who turns back soonest is the most progressive.
~ C.S. Lewis

Author: Colin Twiggs is a former investment banker with almost 40 years of experience in financial markets. He co-founded Incredible Charts and writes the popular Trading Diary and Patient Investor newsletters.
Using a top-down approach, Colin identifies key macro trends in the global economy before evaluating selected opportunities using a combination of fundamental and technical analysis.
Focusing on interest rates and financial market liquidity as primary drivers of the economic cycle, he warned of the 2008/2009 and 2020 bear markets well ahead of actual events.
He founded PVT Capital (AFSL No. 546090) in May 2023, which offers investment strategy and advice to wholesale clients.
