More Uncertainty
By Colin Twiggs
July 12, 2010 7:30 a.m. ET (9:30 p.m. AET)
These extracts from my trading diary are for educational purposes and should not be interpreted as investment or trading advice. Full terms and conditions can be found at Terms of Use.
For seventeen years between 1965 and 1982 the Dow failed to make any headway, with the economy suffering a period of low growth and high inflation, nowadays referred to as stagflation. False signals were common as the index breached support then resistance before retreating into a ranging market.
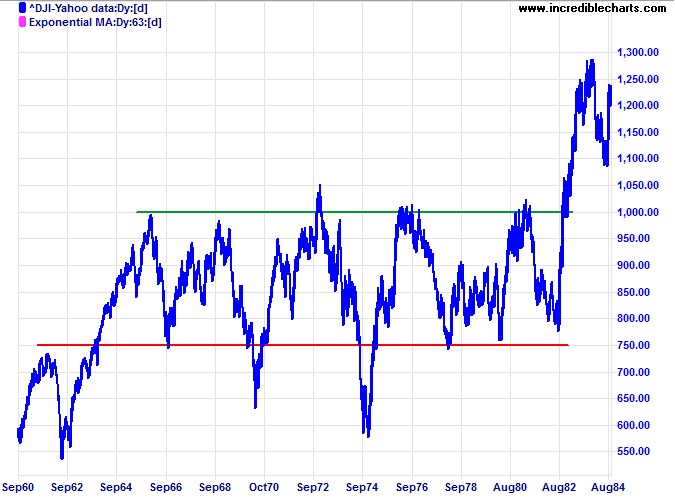
We are not in a ranging market at present, but face a similar period of low growth and uncertainty over the next decade as financial markets attempt to scale back some of the excesses from the credit expansion of the last three decades. If this occurs, long-term investors will experience a frustrating lack of growth — while traders could benefit from the increased volatility.
USA
Dow Jones Industrial Average
The Dow is undergoing a broadening consolidation, with the index twice breaching primary support only to retreat above the new resistance level at 10000. Twiggs Money Flow (13-week) remains bearish, however, warning of another test of primary support in the weeks ahead. Recovery above 10500 is less likely, but would indicate a test of the upper boundary of the broadening wedge.
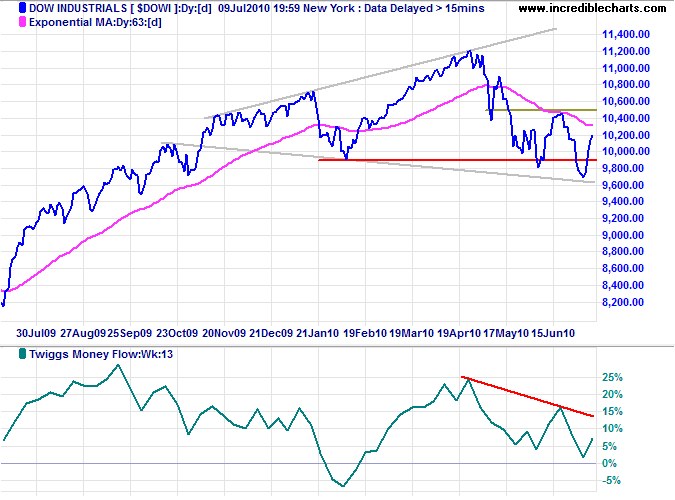
* Target calculation: 10000 - ( 11000 - 10000 ) = 9000
S&P 500
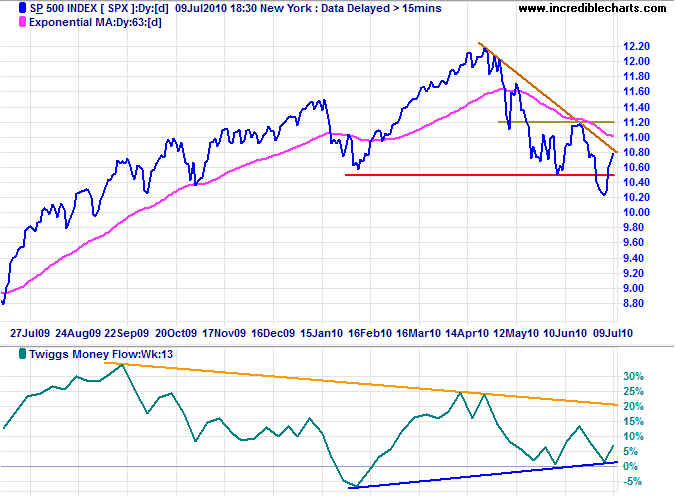
The S&P 500 shows greater buying support on Twiggs Money Flow (13-week) and recovery above 1120 would indicate an advance to 1220. Reversal below 1050, however, would confirm a bear market.
Transport
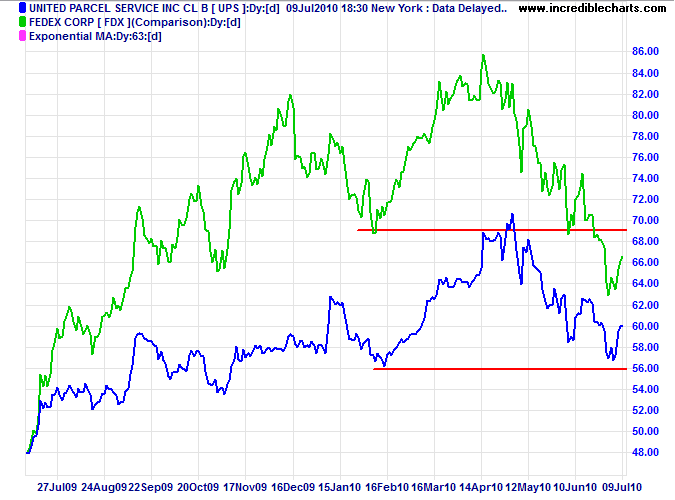
Bellwether transport stock UPS respected primary support at $56, failing to join Fedex in a primary down-trend, and offering some hope of an increase in economic activity. Breach of support would confirm the Fedex bear signal.
Technology
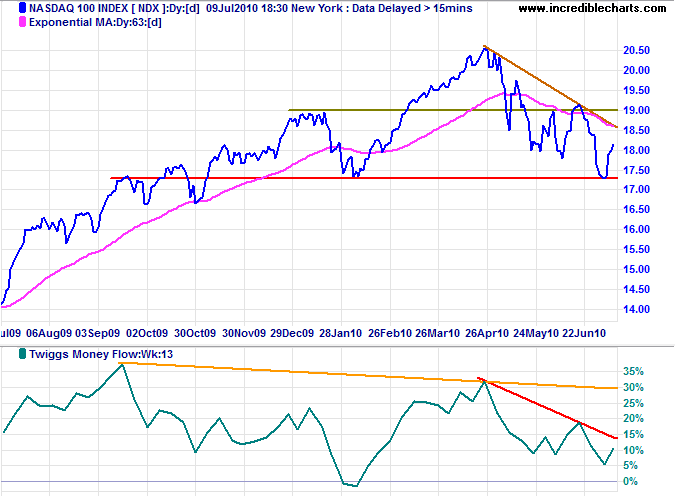
The Nasdaq 100 is retracing to test the declining trendline. Recovery above 1920 would indicate that the correction has ended, while reversal below 1730 would signal a primary down-trend. Twiggs Money Flow (13-week) remains bearish.
Canada: TSX
The TSX Composite signaled a primary down-trend before retreating above the new resistance level at 11400. Breakout above 12000 would signal that the bear trend has ended — as would Twiggs Money Flow (13-week) holding above zero. Reversal below 11400, however, would confirm the primary down-trend.
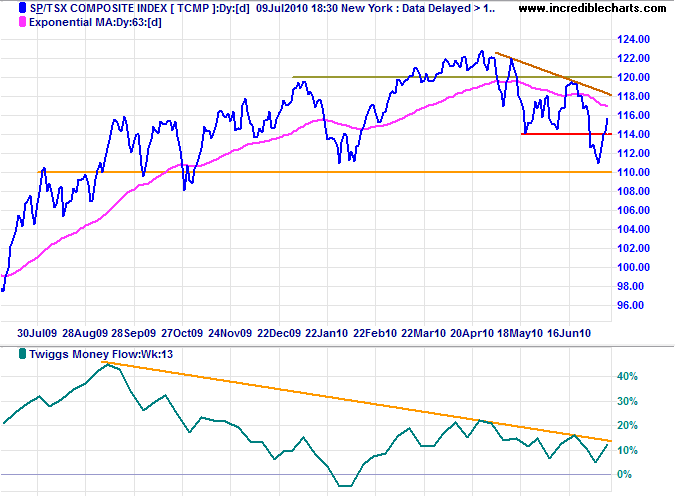
* Target calculation: 11400 - ( 12000 - 11400 ) = 10800
United Kingdom: FTSE
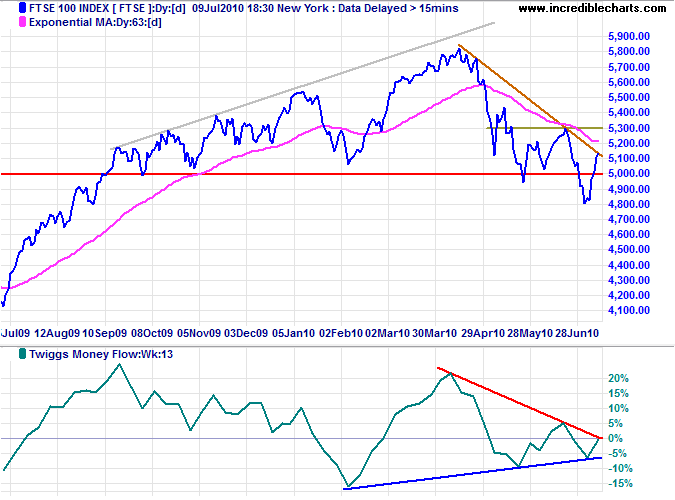
The FTSE 100 shows a similar formation to the Dow: recovering above the new resistance level at 5000. Twiggs Money Flow (13-week) oscillating around the zero line in a triangular pattern, however, is neutral. Respect of resistance at 5300 would confirm the bear market, while breakout would indicate an advance to 5800.
Germany: DAX
The DAX is more positive and, having respected support at 5700, is headed for a test of resistance at 6300. Breakout from the broad (5700 to 6300) consolidation would indicate future direction.
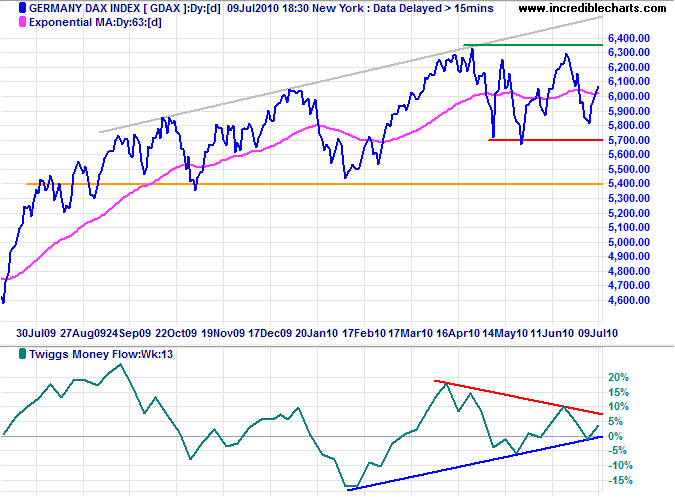
* Target calculation: 6300 + ( 6300 - 5700 ) = 6900
India: Sensex
The Sensex consolidated in a narrow range on Monday, immediately below resistance at 18000. Upward breakout is likely and would offer a target of 20000*. A completed higher trough on Twiggs Money Flow (13-week) would indicate strong buying pressure.
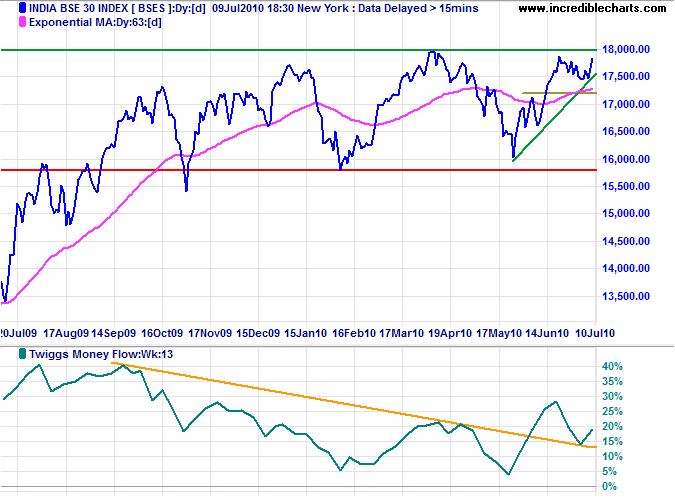
* Target calculation: 18000 + ( 18000 - 16000 ) = 20000
Japan: Nikkei
The Nikkei 225 remains in a primary down-trend. Recovery above 10200 is unlikely, but would indicate an advance to 11000, while respect of resistance at 10000 would signal a down-swing to 9000*.
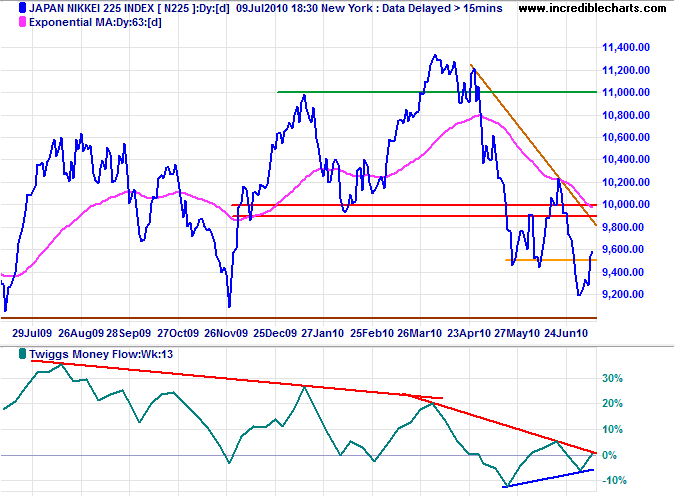
* Target calculation: 10000 - ( 11000 - 10000 ) = 9000
South Korea
The Seoul Composite, having found support at 1670 is headed for another test of resistance at 1750. Rising Twiggs Money Flow (13-week) suggests a breakout above 1750 which would offer a target of 1950*.
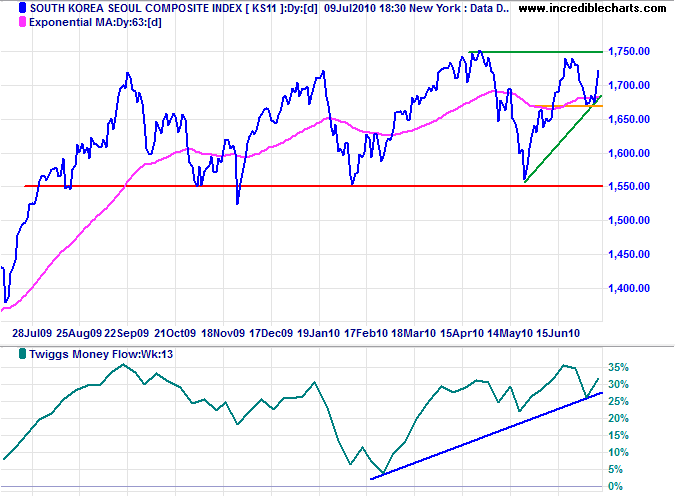
* Target calculation: 1750 + ( 1750 - 1550 ) = 1950
China
The Shanghai Composite Index penetrated its declining trendline, suggesting that the primary down-trend is slowing. Narrow consolidation below 2500 on Monday indicates a breakout that would test 2700. Twiggs Money Flow (13-week) holding above zero confirms buying support. But respect of 2700 would signal a down-swing with a target of 2100*.
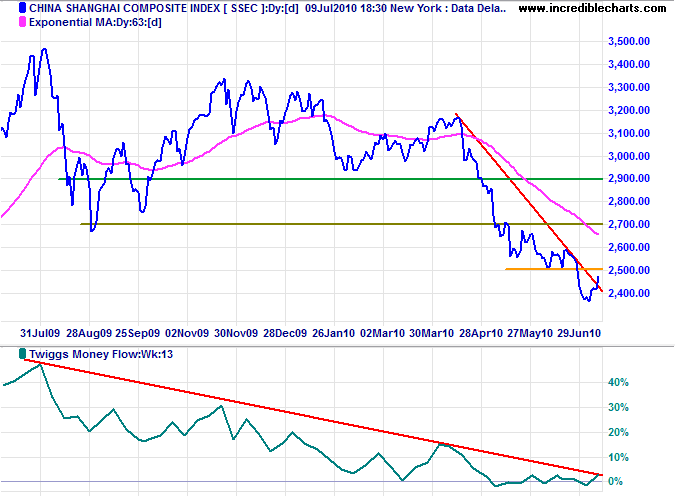
* Target calculations: 2700 - ( 3300 - 2700 ) = 2100
The Hang Seng Index is also testing its declining trendline. Recovery above 21000 would signal reversal to a primary up-trend. Rising Twiggs Money Flow (13-week) indicates buying support.
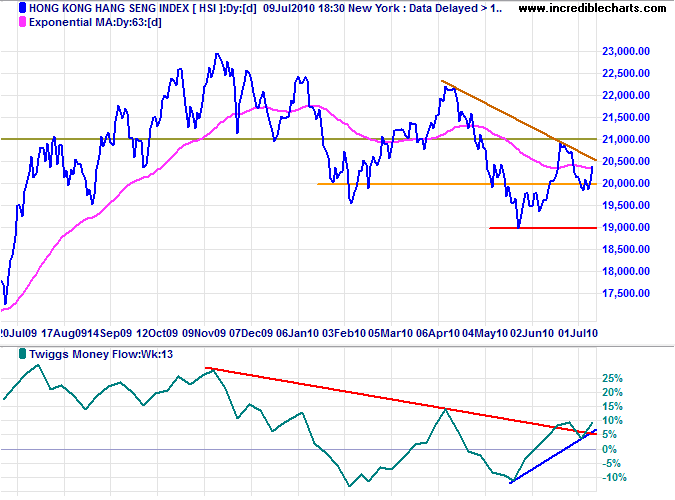
* Target calculations: 19000 - ( 21000 - 19000 ) = 17000
Australia: ASX
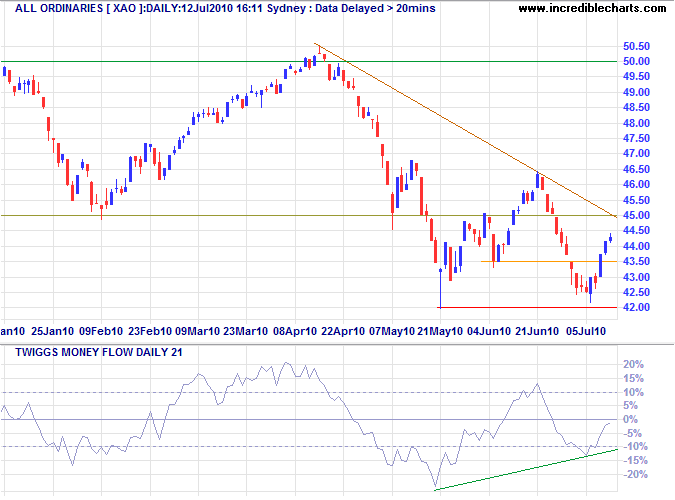
The All Ordinaries is headed for another test of the new resistance level at 4500. Respect would confirm the primary down-trend, while breakout above 4650 would signal a reversal. Twiggs Momentum (21-day) bearish divergence favors a reversal.
A completed Twiggs Money Flow (13-week) trough above zero on the ASX 200 would indicate strong buying support, suggesting a reversal.
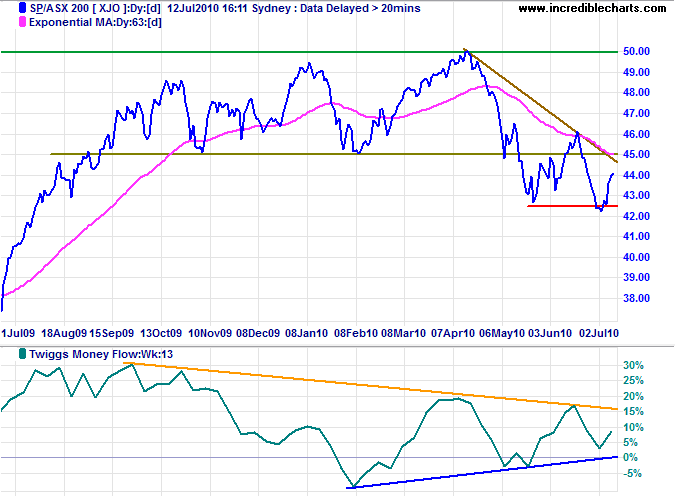
* Target calculation: 4300 - ( 4600 - 4300 ) = 4000
Man is not the enemy of man but through the medium of a false system of government.
~ Thomas Paine: The Rights Of Man (1791)

Author: Colin Twiggs is a former investment banker with almost 40 years of experience in financial markets. He co-founded Incredible Charts and writes the popular Trading Diary and Patient Investor newsletters.
Using a top-down approach, Colin identifies key macro trends in the global economy before evaluating selected opportunities using a combination of fundamental and technical analysis.
Focusing on interest rates and financial market liquidity as primary drivers of the economic cycle, he warned of the 2008/2009 and 2020 bear markets well ahead of actual events.
He founded PVT Capital (AFSL No. 546090) in May 2023, which offers investment strategy and advice to wholesale clients.
