Bear Trap Recovery?
By Colin Twiggs
June 14, 2010 3:30 a.m. ET (5:30 p.m. AET)
These extracts from my trading diary are for educational purposes and should not be interpreted as investment or trading advice. Full terms and conditions can be found at Terms of Use.
A number of major markets, including the Nikkei 225 and Shanghai Composite, have indicated the start of a primary down-trend, but there are now signs of a widespread resurgence, with bullish divergence on Twiggs Money Flow (13-week) warning of a bear trap.
USA
Dow Jones Industrial Average
The Dow recovered above its declining trendline, while Twiggs Money Flow (13-week) displays a bullish divergence. Breakout above 10300 would indicate a bear trap.
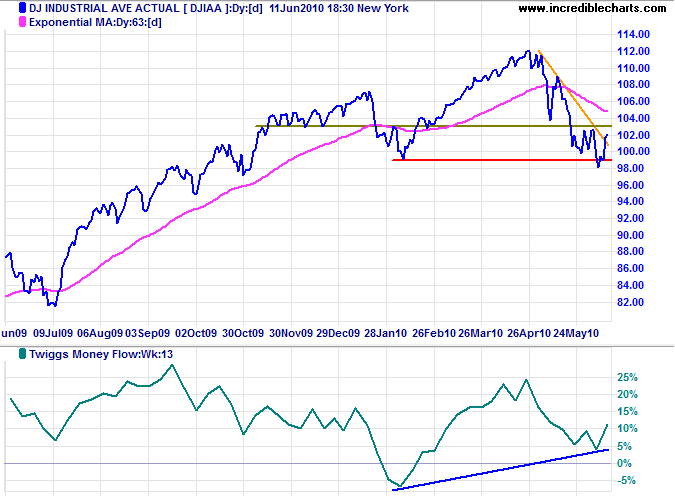
* Target calculation: 10000 - ( 11000 - 10000 ) = 9000
S&P 500
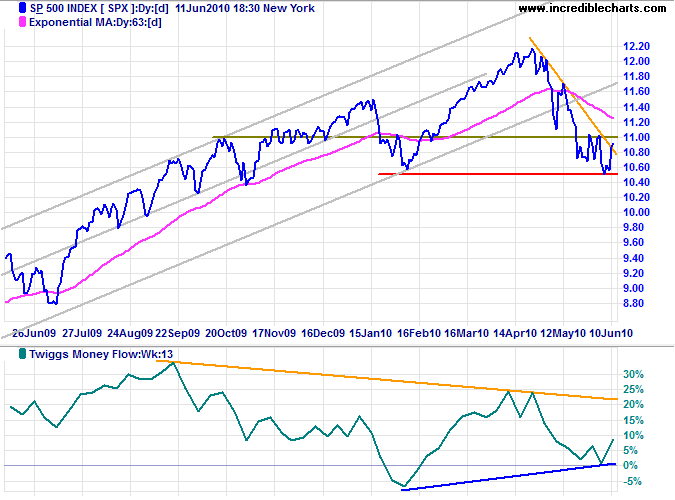
S&P 500 paints a similar picture and recovery above 1100 would signal that the correction has ended.
Transport
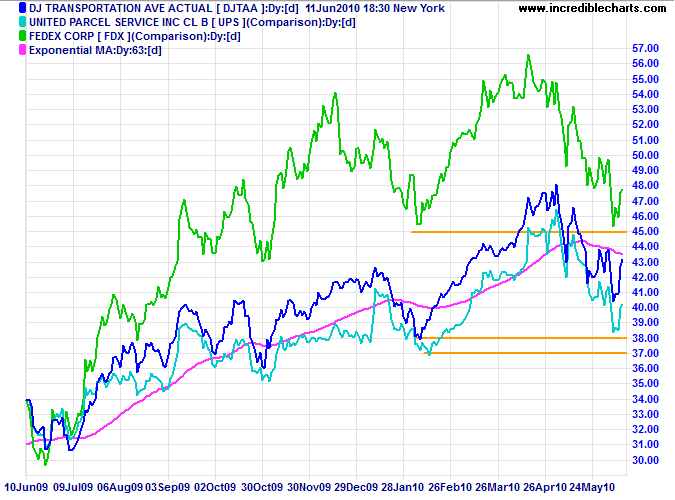
Transport indicators are testing primary support. Respect would strengthen hope of a recovery.
Technology
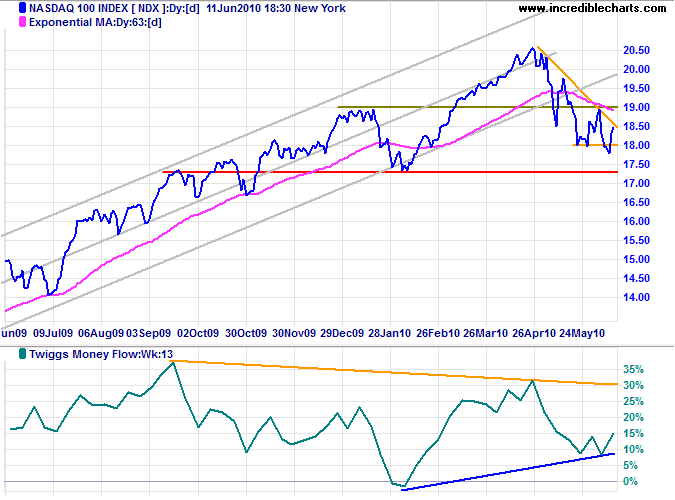
The Nasdaq 100 shows a similar bullish divergence on Twiggs Money Flow (13-week). Recovery above 1900 would signal the end of the correction.
Canada: TSX
The TSX Composite respected short-term support at 11400, and recovery above 11800 would signal another test 12300. Twiggs Money Flow (13-week) remains weak and failure of support at 11400 would test of primary support at 11000.
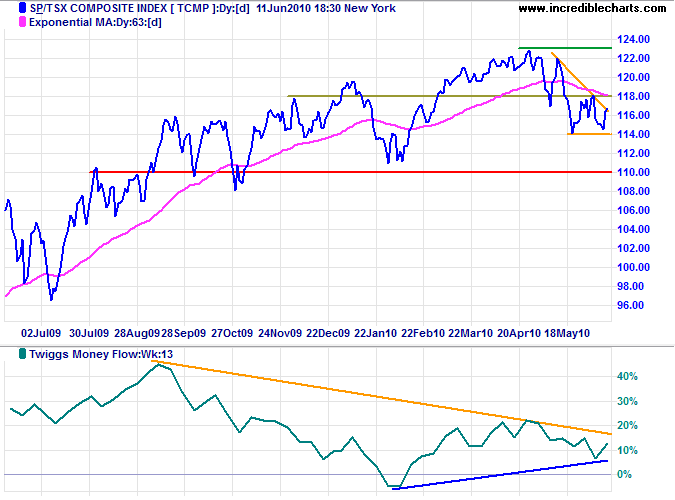
* Target calculation: 11400 - ( 11800 - 11400 ) = 11000
United Kingdom: FTSE
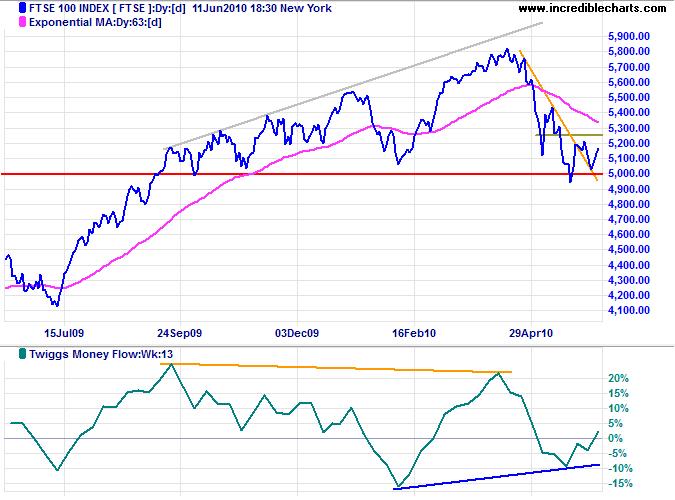
The FTSE 100 recovered above its descending trendline, and bullish divergence on Twiggs Money Flow (13-week) warns of a reversal. Breakout above 5250 would confirm a bear trap.
Germany: DAX
DAX recovery above its descending trendline would support the bullish divergence on Twiggs Money Flow (13-week), suggesting a fresh primary advance.
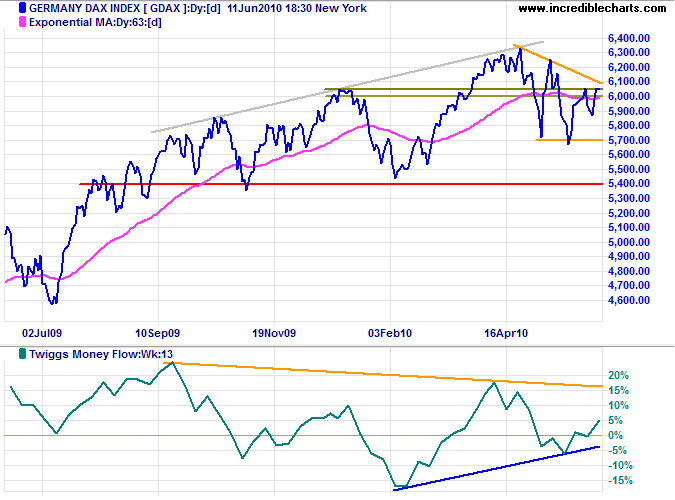
* Target calculation: 5700 - ( 6000 - 5700 ) = 5400
India: Sensex
Sensex recovery above 17200 would confirm Twiggs Money Flow (13-week) breakout above its descending trendline, signaling an advance to 18000*.
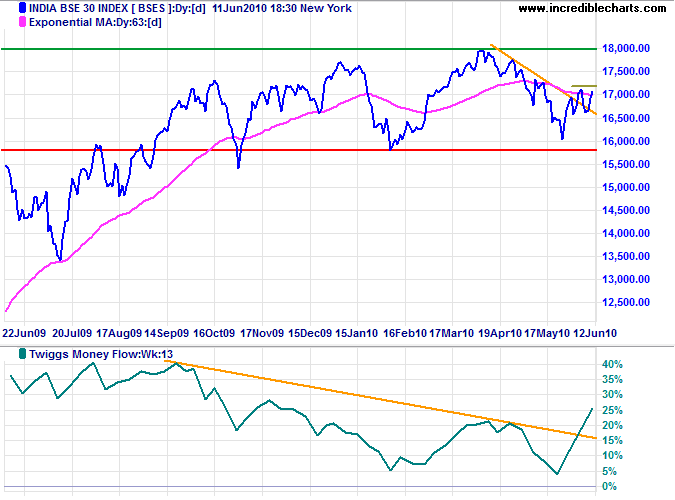
* Target calculation: 17000 + ( 17000 - 16000 ) = 18000
Japan: Nikkei
The Nikkei 225 is weaker, with declining Twiggs Money Flow (13-week) indicating selling pressure. Failure of support at 9400 would offer a target of 9000*. Recovery above 10000 is less likely, but would warn of a bear trap.
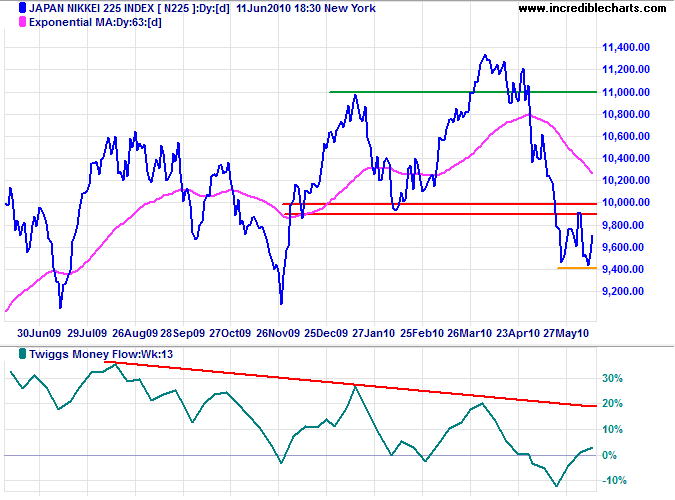
* Target calculation: 10000 - ( 11000 - 10000 ) = 9000
South Korea
The Seoul Composite is advancing to 1750. Expect some resistance at 1700. Strong bullish divergence on Twiggs Money Flow (13-week) indicates an advance to 1950*.
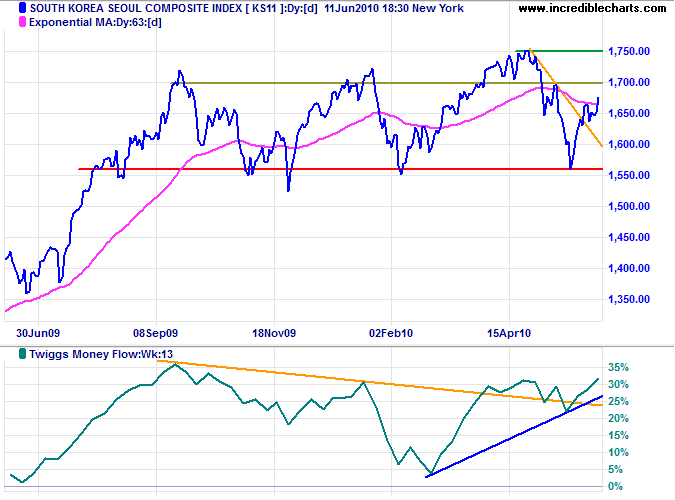
* Target calculation: 1750 + ( 1750 - 1550 ) = 1950
China
The Shanghai Composite Index remains in a primary down-trend. Small bullish divergence on Twiggs Money Flow (13-week) indicates short-term buying support. The long-term target for the decline remains at 2100*, but positive signs on the Hang Seng suggest a recovery. Breakout above 2700 would warn of a bear trap.
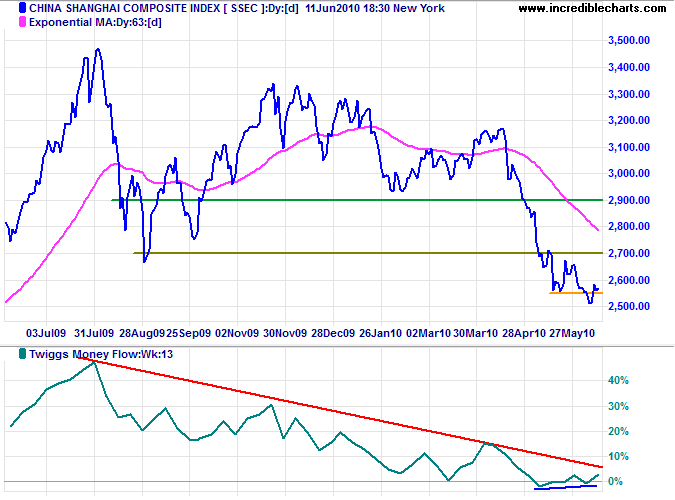
* Target calculations: 2900 - ( 3500 - 2700 ) = 2100
The Hang Seng Index gapped above 20000 on Monday, warning of a bear trap. Bullish divergence on Twiggs Money Flow (13-week) would support the picture — strengthened if there is a breakout above the descending trendline.
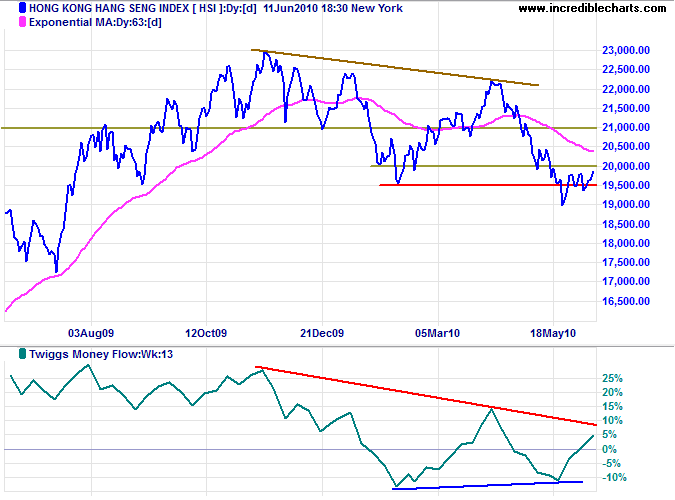
* Target calculations: 19500 - ( 22000 - 19500 ) = 17000
Commodities & Resources Stocks
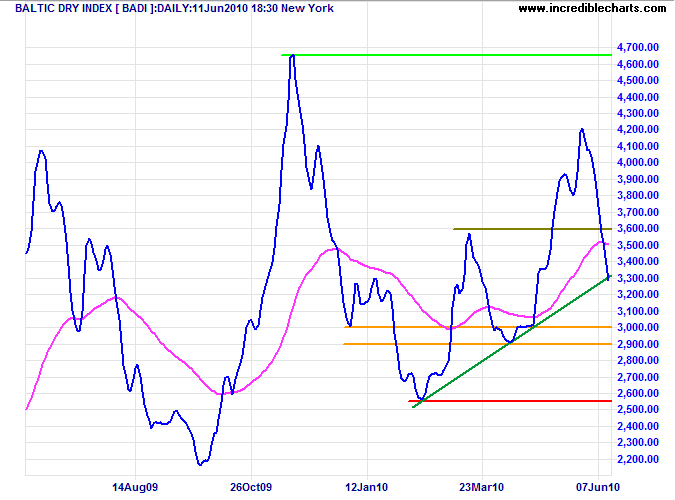
The Baltic Dry Index is weakening, and is supported by the Baltic Panamax index (which has not been subjected to such a large influx of new vessels as the Capesize class). Declining shipping rates would reflect a fall-off in demand for dry-bulk commodities such as iron ore and coal.
Australia: ASX
The All Ordinaries is closed on Monday but Friday's trade closed above 4500, warning of a bear trap. Rising Twiggs Money Flow (21-day) indicates short-term buying pressure.
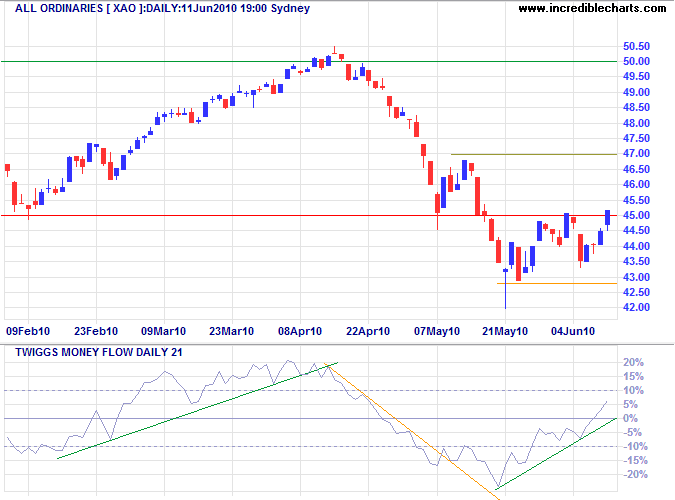
* Target calculation: 4500 - ( 5000 - 4500 ) = 4000
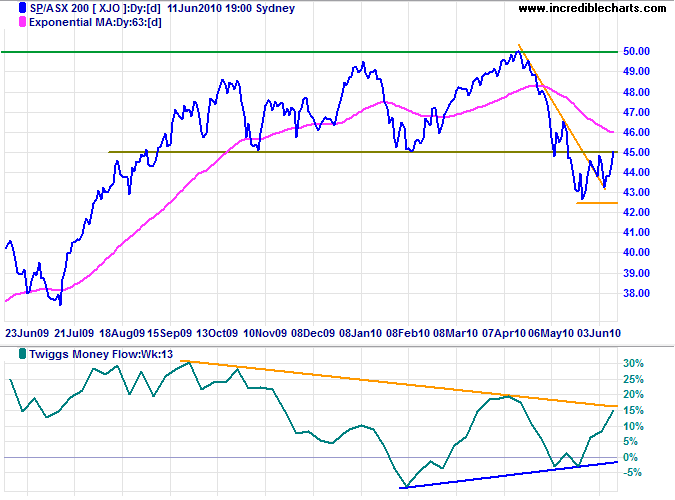
The ASX 200 also closed above 4500, while bullish divergence on Twiggs Money Flow (13-week) warns of a fresh advance to 5000.
Concern should drive us into action and not into a depression.
No man is free who cannot control himself.
~ Pythagoras (582 B.C. - 497 B.C.)

Author: Colin Twiggs is a former investment banker with almost 40 years of experience in financial markets. He co-founded Incredible Charts and writes the popular Trading Diary and Patient Investor newsletters.
Using a top-down approach, Colin identifies key macro trends in the global economy before evaluating selected opportunities using a combination of fundamental and technical analysis.
Focusing on interest rates and financial market liquidity as primary drivers of the economic cycle, he warned of the 2008/2009 and 2020 bear markets well ahead of actual events.
He founded PVT Capital (AFSL No. 546090) in May 2023, which offers investment strategy and advice to wholesale clients.
