Recovery Gathers Momentum
By Colin Twiggs
March 8, 2010 00:30 a.m. ET (4:30 p.m. AET)
These extracts from my trading diary are for educational purposes and should not be interpreted as investment or trading advice. Full terms and conditions can be found at Terms of Use.
North American and European markets are recovering, with momentum rising and the FTSE 100 signaling a primary advance to 6000. Asian markets are slower to recover, but rising bulk shipping rates are an encouraging sign for resources stocks.
Commodities & Resources Stocks
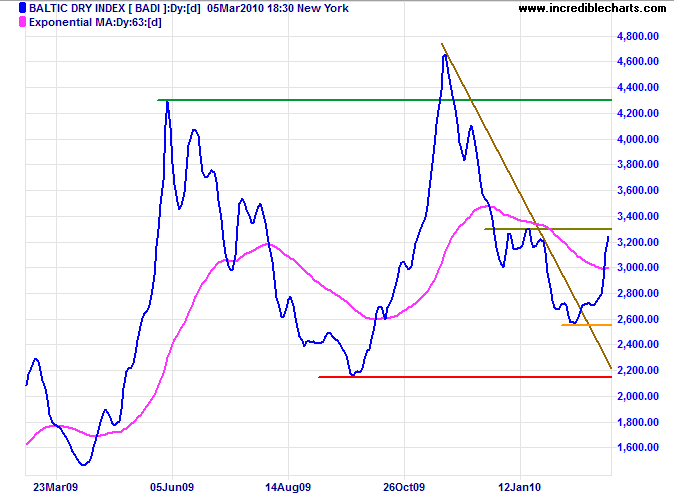
The Baltic Dry Index is testing resistance at 3300; breakout would signal the end of the correction and a surge in shipments of bulk commodities — especially since new deliveries of Capemax vessels in the last 6 months have increased available tonnage. Reversal below support at 2550 is unlikely, but would test primary support at 2150.
USA
Dow Jones Industrial Average
The Dow broke through resistance at 10450, signaling a test of the January high at 10750. Rising Twiggs Money Flow (21-day) confirms buying pressure. Breakout above 10450 would offer a target of 11500*. Reversal below 9900 is most unlikely, but would signal a primary down-trend.
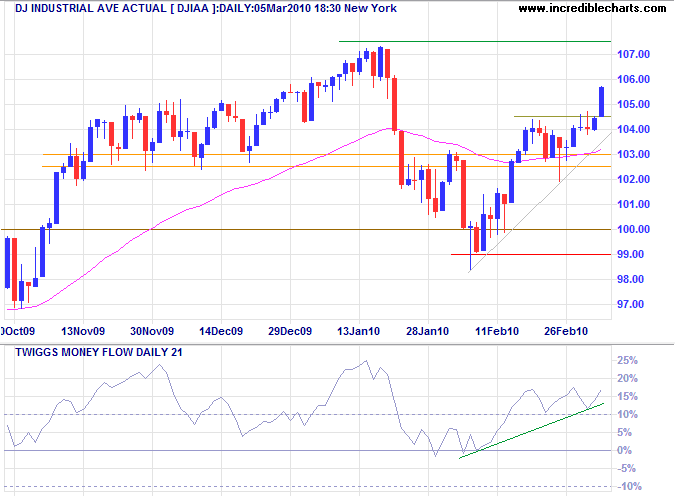
* Target calculation: 10700 + ( 10700 - 9900 ) = 11500
S&P 500
The S&P 500 is headed for a test of 1150. Recovery above the descending trendline on Twiggs Money Flow (13-week) signals buying pressure. Upward breakout would offer a target of 1250*. Reversal below 1050 is most unlikely, but would signal a primary down-trend.
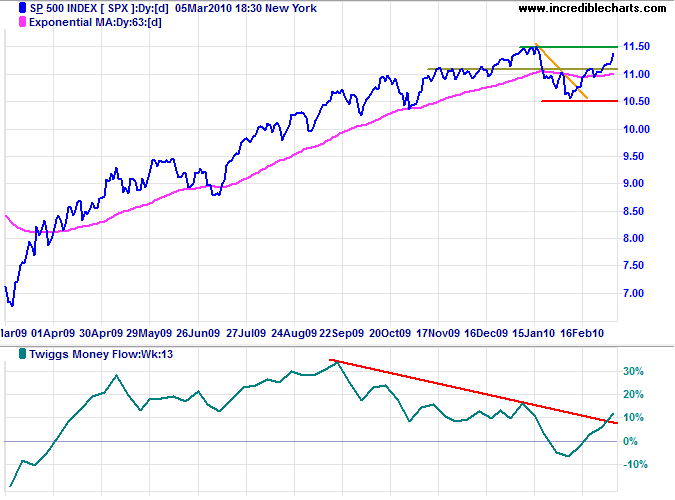
* Target calculation: 1150 + ( 1150 - 1050 ) = 1250
Transport
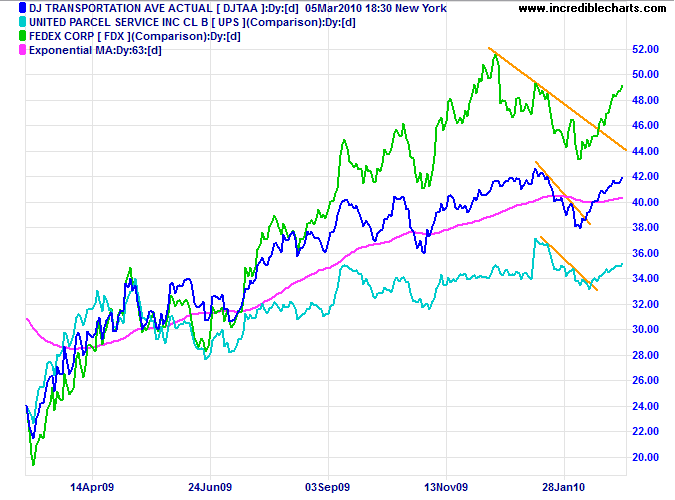
Fedex, UPS and the Dow Transport Average all indicate that the secondary correction has ended.
Technology
The Nasdaq 100 is testing resistance at 1900. Recovery above the descending trendline on Twiggs Money Flow (13-week) indicates buying pressure. Upward breakout would offer a target of 2050*. Reversal below 1730 is most unlikely, but would signal a primary down-trend.
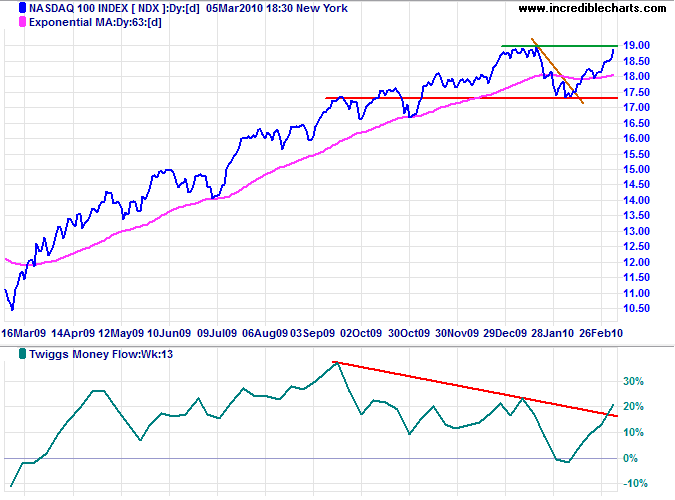
* Target calculation: 1900 + ( 1900 - 1750 ) = 2050
Canada: TSX
The TSX Composite is testing 12000; breakout would signal an advance to 13000*. Twiggs Money Flow (13-week) above the descending trendline indicates buying pressure. Reversal below 11100 is most unlikely, but would signal a primary down-trend.
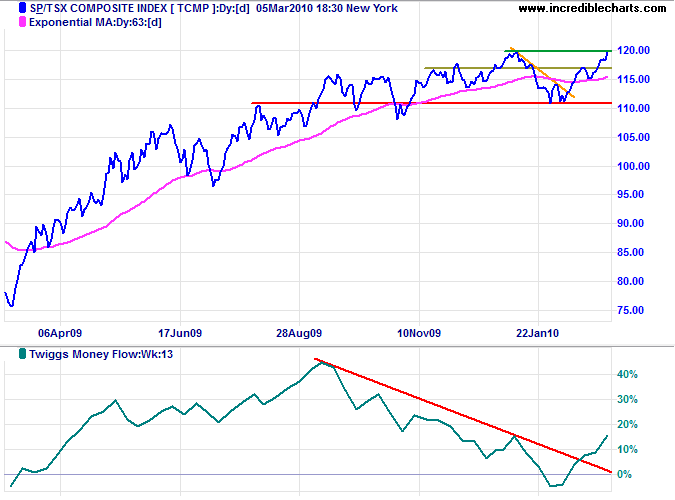
* Target calculation: 12000 + ( 12000 - 11000 ) = 13000
United Kingdom: FTSE
The FTSE 100 broke through resistance at 5550, signaling an advance to 6000*. Twiggs Money Flow (13-week) above the declining trendline indicates buying pressure. Short-term resistance at 5600 is unlikely to halt the advance.
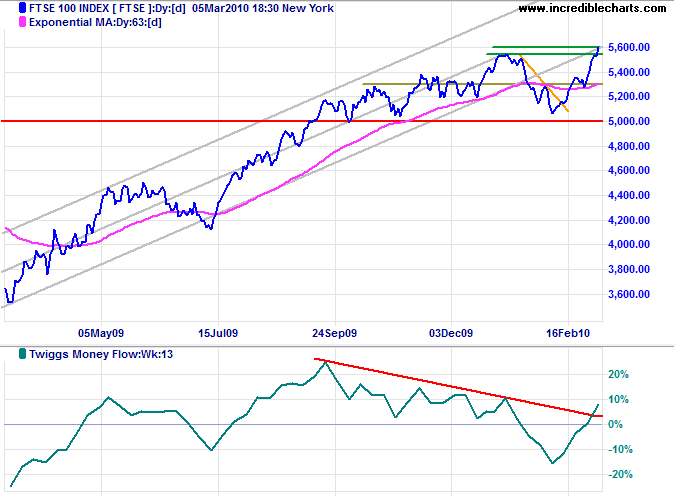
* Target calculation: 5500 + ( 5500 - 5000 ) = 6000
Germany: DAX
The DAX is headed for a test of 6050; breakout would signal an advance to 6600*. Twiggs Money Flow (13-week) below zero, indicates moderate buying pressure, but breakout above the trendline would support the advance. Reversal below support at 5400 is most unlikely, but would signal a primary down-trend.
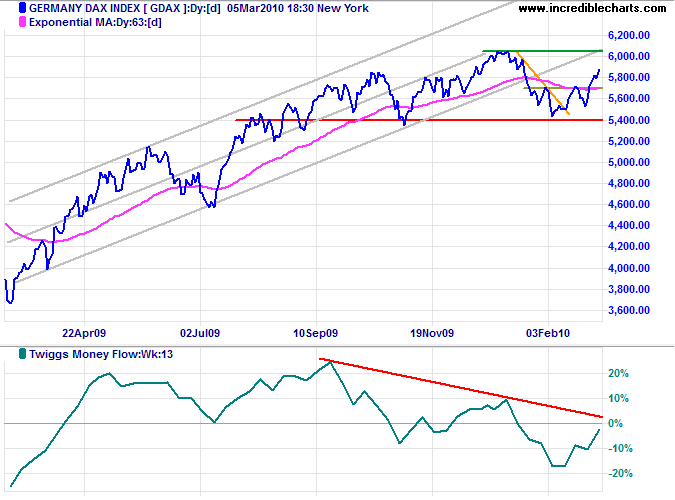
* Target calculation: 6000 +( 6000 - 5400 ) = 6600
India: Sensex
The Sensex recovered above 16500, signaling a test of 17800. Upward breakout would offer a target of 20000*. Twiggs Money Flow (13-week) above the declining trendline indicates buying pressure. Reversal below support at 15500 is now unlikely, but would warn of a primary down-trend.
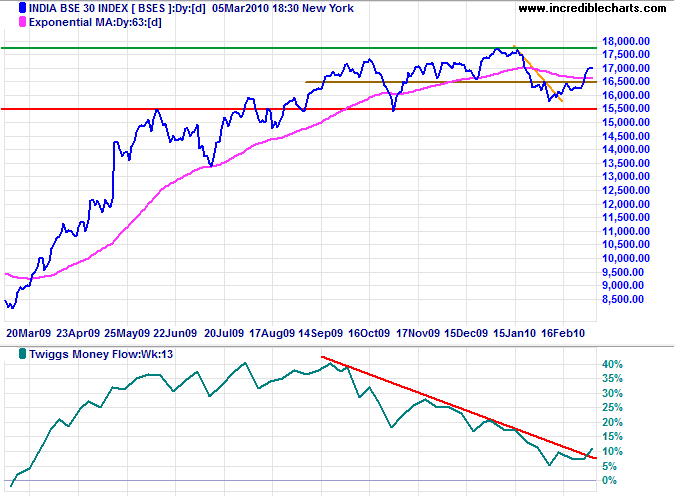
* Target calculation: 17800 + ( 17800 - 15700 ) = 19900
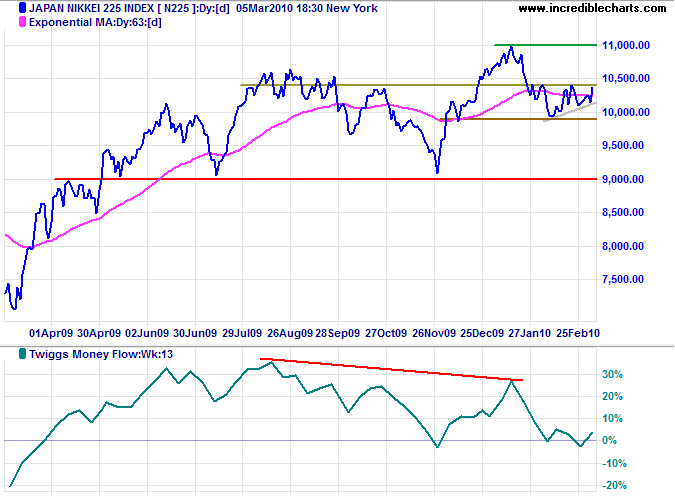
Japan: Nikkei
The Nikkei 225 breakout above the ascending triangle Monday indicates a test of 11000. Twiggs Money Flow (13-week) respected zero, but the bearish divergence continues to warn of weakness. Reversal below 9900 would signal a test of primary support at 9000.
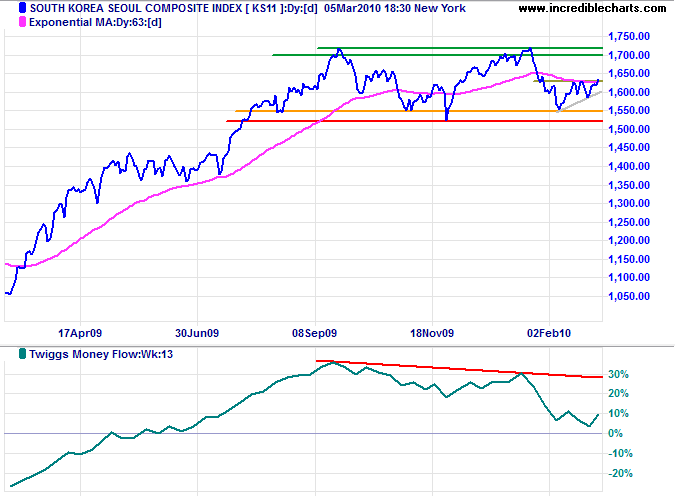
South Korea
The Seoul Composite broke through resistance at 1630, the upper border of an ascending triangle, to signal a test of 1720. Twiggs Money Flow (13-week) respected zero but the bearish divergence indicates weakness. Reversal below primary support at 1520 is unlikely, but would signal a primary down-trend.
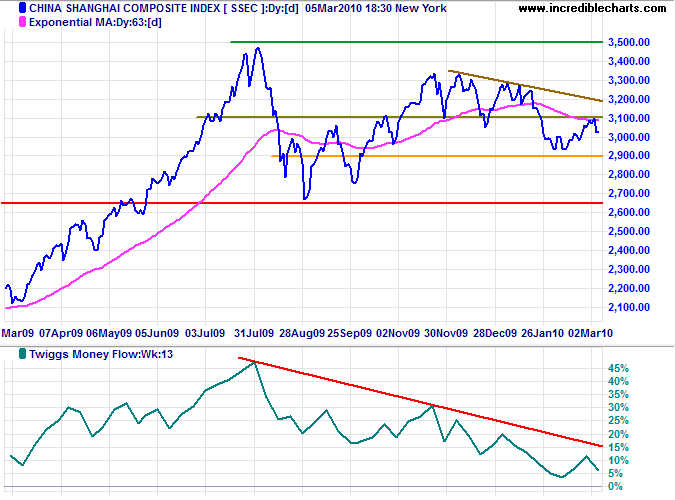
China
The Shanghai Composite Index is headed for another test of short-term resistance at 3100 Monday, having found support at 3000. Breakout above the declining trendline would indicate that the correction is weakening, while reversal below 2900 would test primary support at 2650. Declining Twiggs Money Flow (13-week) continues to warn of selling pressure; recovery above the declining trendline would indicate a reversal.
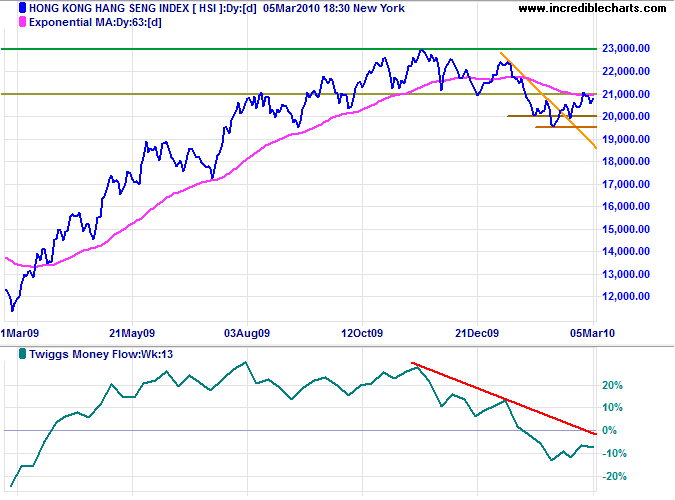
The Hang Seng Index gapped above 21000 Monday, indicating that the primary down-trend is weakening. Twiggs Money Flow (13-week) recovery above the declining trendline would confirm, while respect of the zero line (from below) would warn of selling pressure.
Australia: ASX
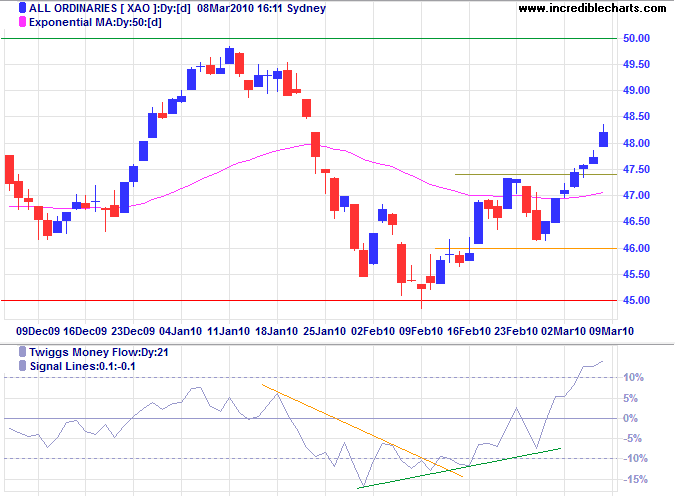
The All Ordinaries broke through short-term resistance at 4740, indicating a test of 5000. Rising Twiggs Money Flow (21-day) indicates buying pressure. Reversal through support at 4500 is now unlikely, but would signal a primary down-trend.
The longer-term ASX 200 chart reflects broad consolidation between 4500 and 5000; breakout will signal future direction. Twiggs Money Flow (13-week) recovery above the declining trendline indicates buying pressure. Breakout above 5000 would offer a target of 5500*, while reversal below the base would offer a target of 4000*.
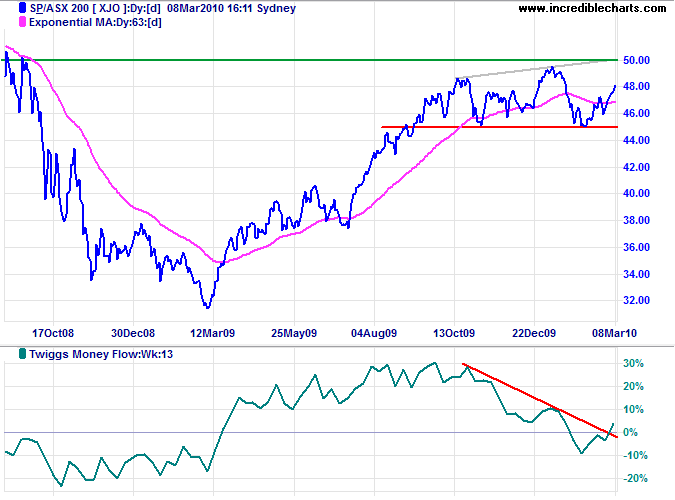
* Target calculations: 5000 + ( 5000 - 4500 ) = 5500 and 4500 - ( 5000 - 4500 ) = 4000
If you do what you've always done, you'll get what you've always gotten.
~ Tony Robbins

Author: Colin Twiggs is a former investment banker with almost 40 years of experience in financial markets. He co-founded Incredible Charts and writes the popular Trading Diary and Patient Investor newsletters.
Using a top-down approach, Colin identifies key macro trends in the global economy before evaluating selected opportunities using a combination of fundamental and technical analysis.
Focusing on interest rates and financial market liquidity as primary drivers of the economic cycle, he warned of the 2008/2009 and 2020 bear markets well ahead of actual events.
He founded PVT Capital (AFSL No. 546090) in May 2023, which offers investment strategy and advice to wholesale clients.
