West Slowly Recovers
By Colin Twiggs
March 1st, 2010 6:00 a.m. ET (10:00 p.m. AET)
These extracts from my trading diary are for educational purposes and should not be interpreted as investment or trading advice. Full terms and conditions can be found at Terms of Use.
North American and European markets are slowly recovering, while most Asian markets weaken. Global equity markets are losing momentum and it may be some time before we see another bull market.
USA
Dow Jones Industrial Average
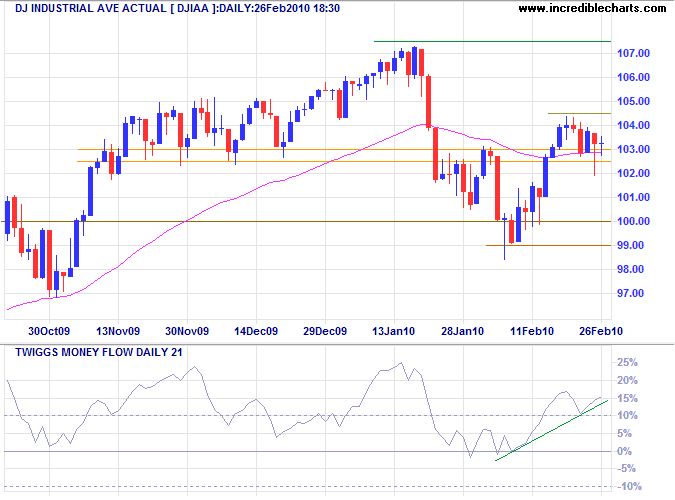
The Dow found support after brief retracement to 10250, suggesting a breakout above 10450 — and a test of the January high at 10750. Reversal below 9900 is unlikely, but would warn of a correction to 9000. Rising Twiggs Money Flow (21-day) confirms buying pressure.
S&P 500
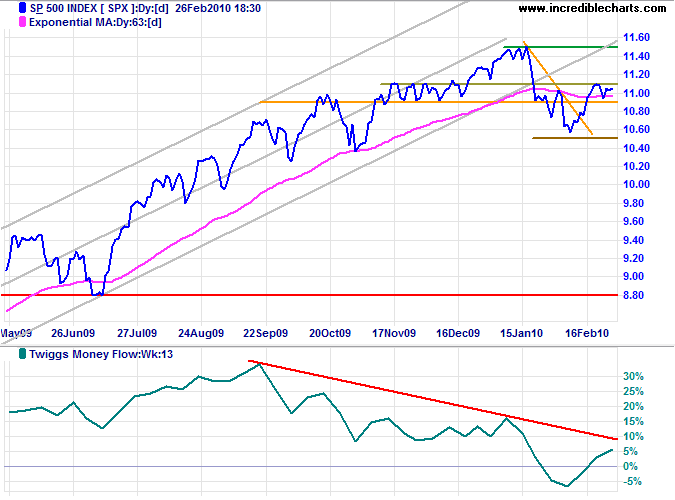
The S&P 500 is consolidating in a narrow band between 1090 and 1110. Upward breakout is likely and would signal a test of 1150. Recovery above the descending trendline on Twiggs Money Flow (13-week) would strengthen the signal.
Transport
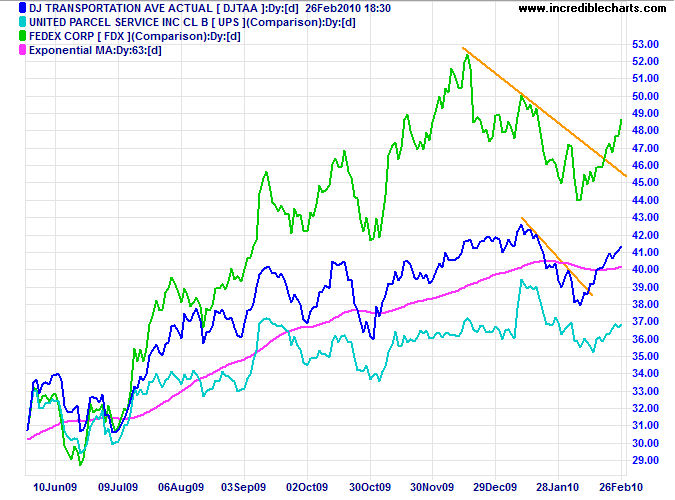
Fedex, UPS and the Dow Transport Average all show that the secondary correction has ended.
Technology
The Nasdaq 100 found support at 1790 after a short retracement, suggesting a breakout above 1830 followed by a test of 1900. The sharp rise on Twiggs Money Flow (21-day) indicates strong buying pressure. Breakout above 1900 would offer a target of 2050*.
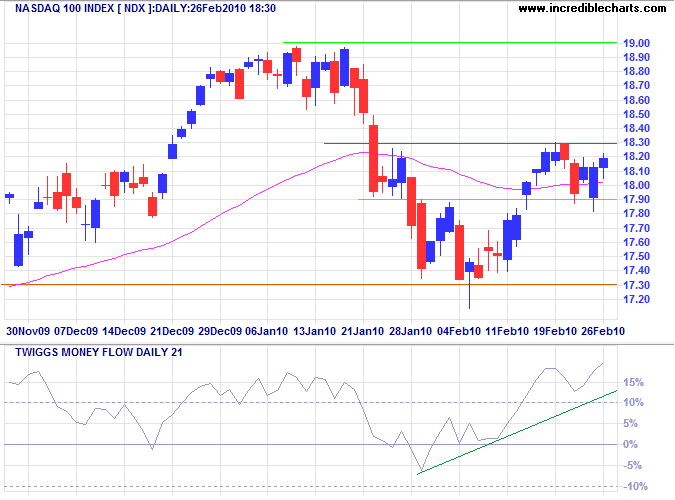
* Target calculation: 1900 + ( 1900 - 1750 ) = 2050
Canada: TSX
The TSX Composite shows similar strength, brief retracement to 11500 suggesting a test of 12000. Twiggs Money Flow (13-week) respect of the zero line would indicate a primary advance to 13000* — confirmed if there is a breakout above 12000 on the price chart. Reversal below 11000 is unlikely, but would warn of a strong correction.
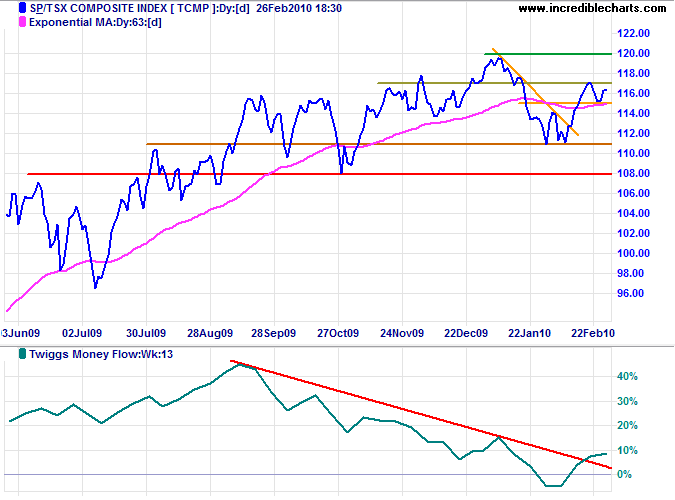
* Target calculation: 12000 + ( 12000 - 11000 ) = 13000
United Kingdom: FTSE
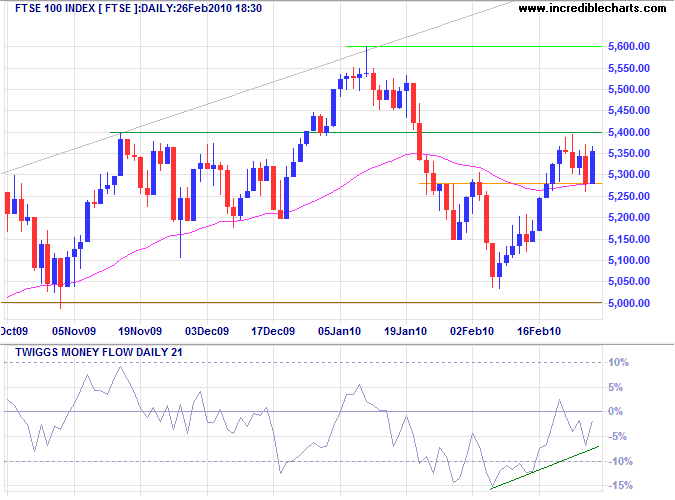
The FTSE 100 also experienced a weak retracement, but Twiggs Money Flow (21-day) remains below zero. Breakout above 5400 would signal a test of the January high at 5600, while reversal below 5280 would warn of a test of primary support at 5000 — raising fears of a head-and-shoulders reversal.
Germany: DAX
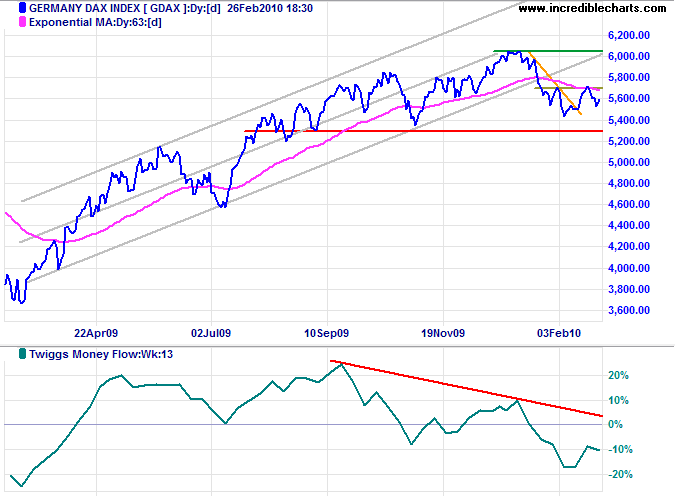
The DAX is similarly consolidating below 5700, suggesting a test of 6000. The large bearish divergence on Twiggs Money Flow (13-week), however, warns of further weakness. Failure of support at 5300 would indicate a primary down-trend.
India: Sensex
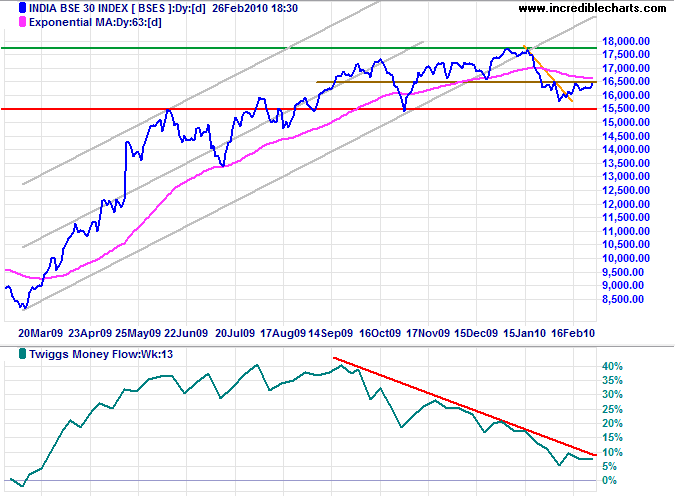
The Sensex narrow consolidation favored an advance to test 17800, but Monday saw a sharp breakout above 16500 followed by an equally sharp retreat. Reversal below support at 15500 would warn of a primary down-trend. Twiggs Money Flow (13-week) recovery above the declining trendline, however, would indicate buying pressure.
Japan: Nikkei
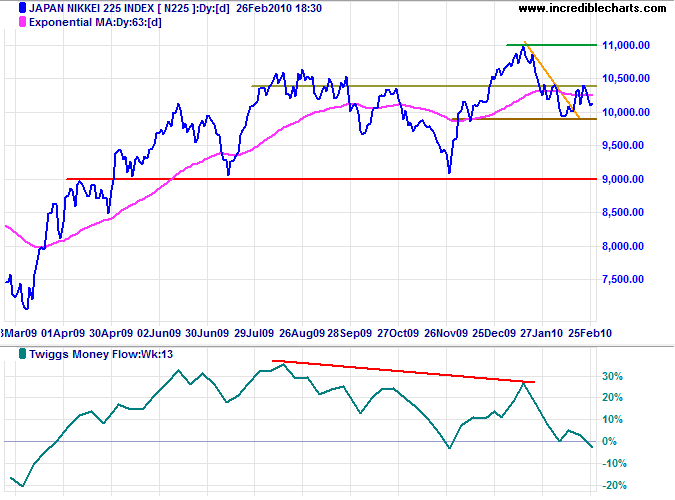
The Nikkei 225 is edging towards short-term support at 10000. Failure would signal a test of primary support at 9000, while recovery above 10400 would test 11000. Twiggs Money Flow (13-week) bearish divergence, followed by reversal below zero, warns of strong selling pressure.
South Korea
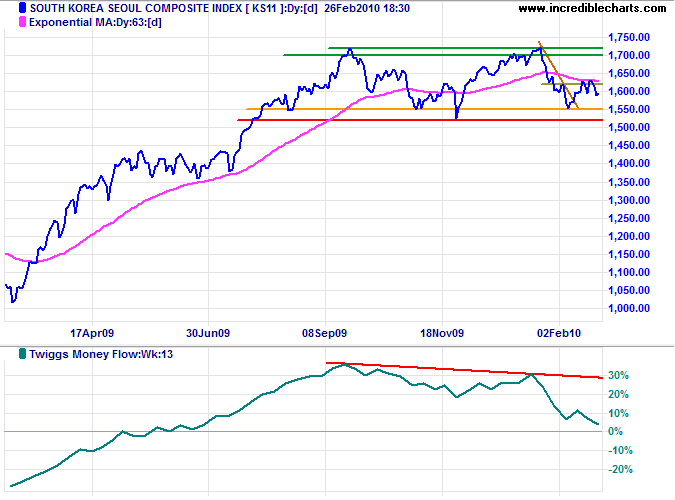
The Seoul Composite twice respected resistance at 1630 before reversing below short-term support at 1600 — signaling a test of primary support at 1520. Twiggs Money Flow (13-week) bearish divergence indicates selling pressure. Failure of primary support would signal a primary down-trend.
China
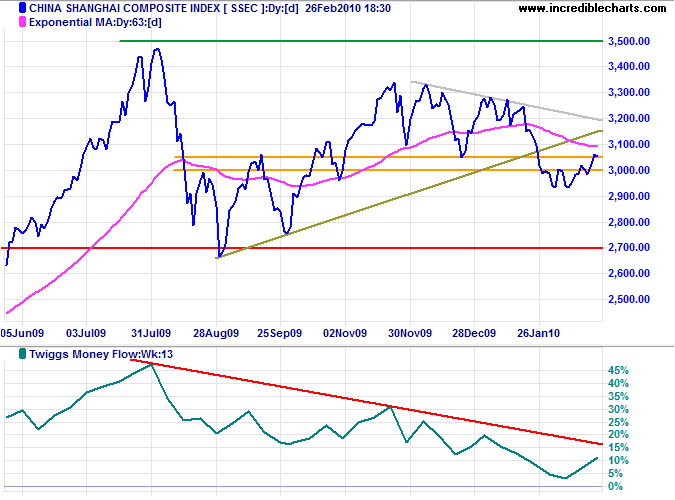
The Shanghai Composite Index edged higher Monday, closing just below 3100, indicating that the correction is weakening. Twiggs Money Flow (13-week) recovery above the declining trendline would indicate buying pressure.
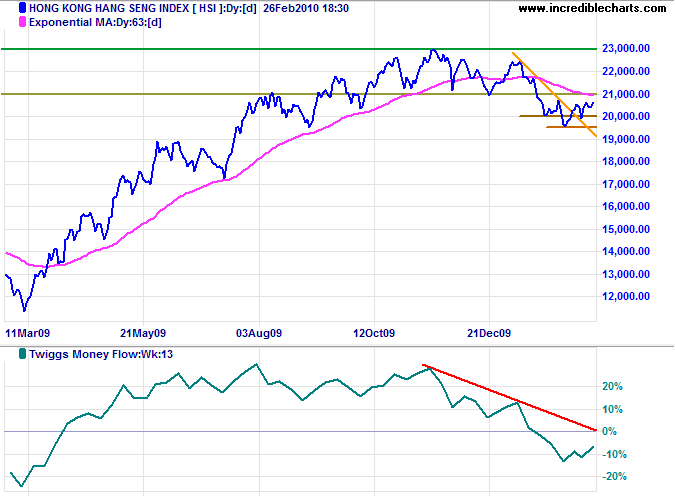
The Hang Seng Index closed (Monday) above resistance at 21000, indicating that the primary down-trend is weakening. Twiggs Money Flow (13-week) recovery above the declining trendline would confirm, while respect of the zero line from below would indicate strong selling pressure.
Commodities & Precious Metals
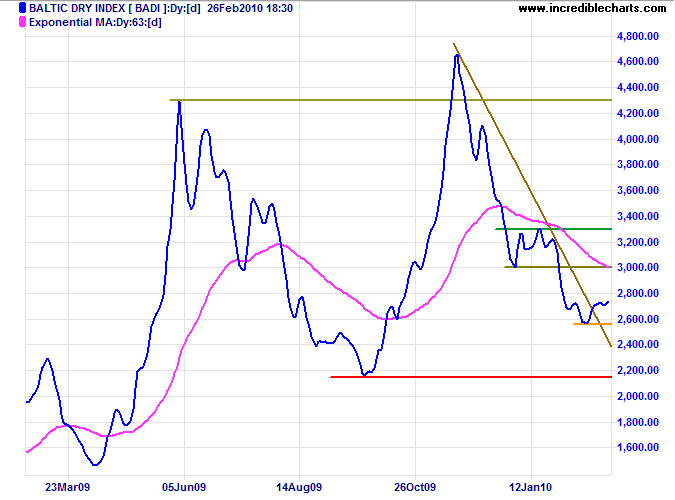
The Baltic Dry Index continues to respect support at 2550, but is still some way from signaling the end of the correction. Failure of support would test the primary level at 2150. A primary down-trend would indicate a bear market for commodities and resources stocks.
Australia: ASX
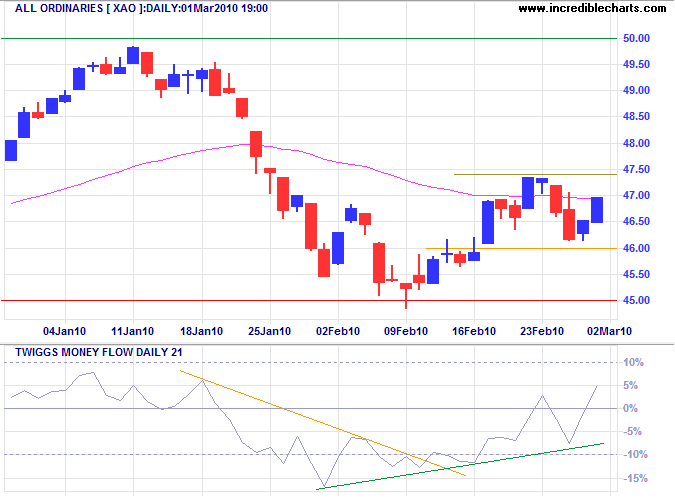
The All Ordinaries is headed for a test of short-term resistance at 4740 after a weak retracement, suggesting a breakout and test of 5000. Twiggs Money Flow (21-day) recovery above zero indicates short-term buying pressure. Reversal through support at 4500 is unlikely, but would warn of a primary down-trend.
The longer-term ASX 200 chart reflects a broad consolidation above a base of 4500. Twiggs Money Flow (13-week) bearish divergence and reversal below zero warn of selling pressure. Breakout below the base would offer a target of 4000*.
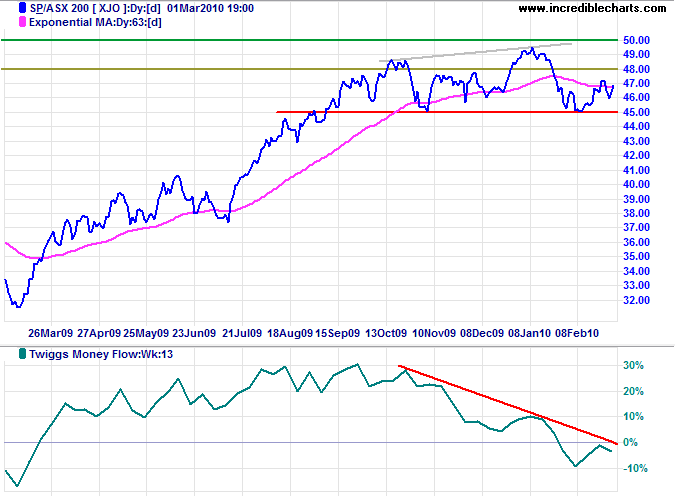
* Target calculation: 4500 - ( 5000 - 4500 ) = 4000
Once you have mastered time, you will understand how true it is that most people overestimate what they can accomplish in a year — and underestimate what they can achieve in a decade!
~ Tony Robbins

Author: Colin Twiggs is a former investment banker with almost 40 years of experience in financial markets. He co-founded Incredible Charts and writes the popular Trading Diary and Patient Investor newsletters.
Using a top-down approach, Colin identifies key macro trends in the global economy before evaluating selected opportunities using a combination of fundamental and technical analysis.
Focusing on interest rates and financial market liquidity as primary drivers of the economic cycle, he warned of the 2008/2009 and 2020 bear markets well ahead of actual events.
He founded PVT Capital (AFSL No. 546090) in May 2023, which offers investment strategy and advice to wholesale clients.
