End Of The Correction
By Colin Twiggs
February 22, 2010 5:30 a.m. ET (9:30 p.m. AET)
These extracts from my trading diary are for educational purposes and should not be interpreted as investment or trading advice. Full terms and conditions can be found at Terms of Use.
The correction appears over, with the Dow and other major markets recovering above recent highs. Long-term momentum, however, is slowing and we are unlikely to see a repeat of the heady gains from 2009. Short- and medium-term trading systems are likely to out-perform long term traders for the foreseeable future — until the global financial system returns to a sound footing, with no artificial support from central banks. It may be some time before we witness another bull market.
USA
Dow Jones Industrial Average
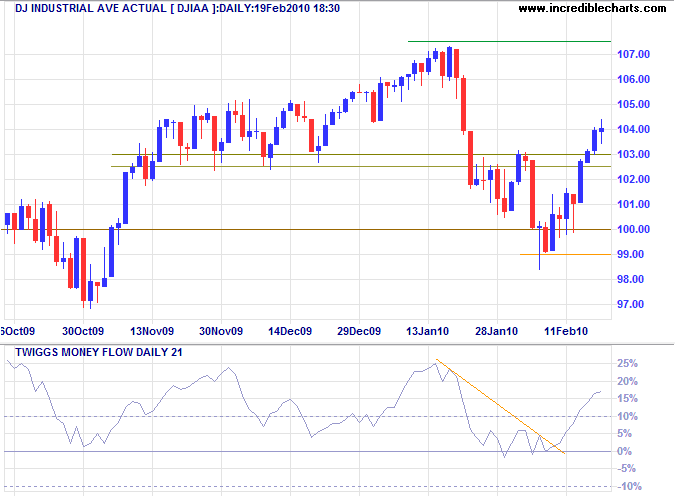
The Dow broke through resistance at 10300 to signal a bear trap, with a target of the January high at 10750. Reversal below 9900 is now unlikely, but would signal correction to 9000 — the base of the long-term broadening wedge. Twiggs Money Flow (21-day) respect of the zero line indicates buying pressure.
S&P 500
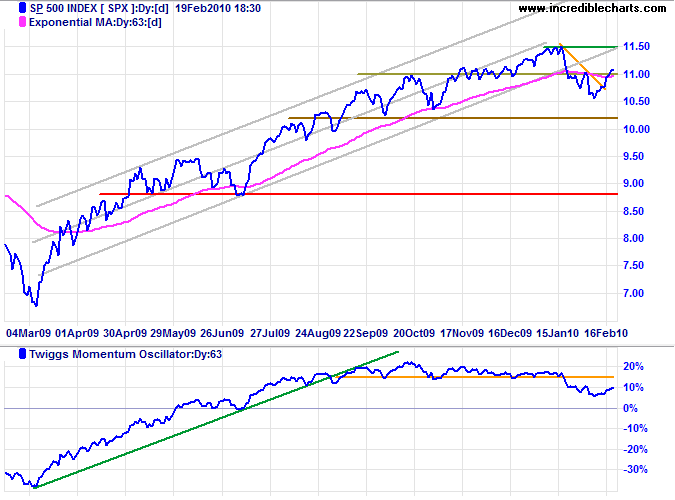
The S&P 500 similarly recovered above resistance at 1100, signaling a test of 1150. In the long term, however, (63-day) Twiggs Momentum Oscillator reinforces the trend channel breakout on the price chart, indicating that momentum is slowing. Further advances are likely to be anemic compared to 2009.
Transport
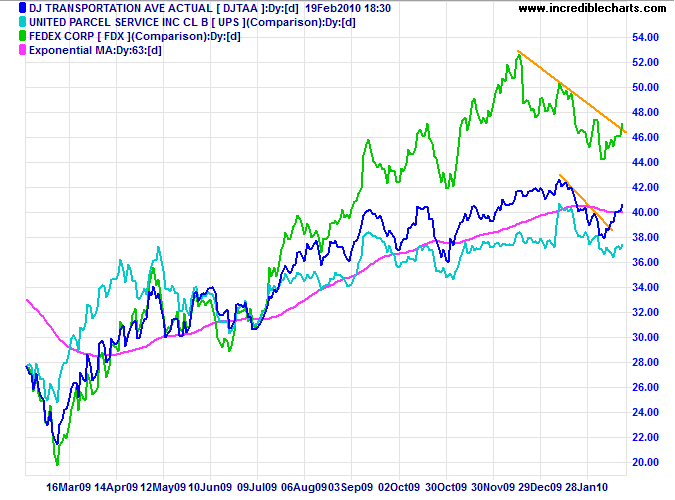
Fedex, UPS and the Dow Transport Average also show signs that the secondary correction has ended.
Technology
The Nasdaq 100 is headed for a test of 1900 after breaking through 1800. Twiggs Money Flow (13-week) recovery above the declining trendline would signal another primary advance, with a target of 2050*.
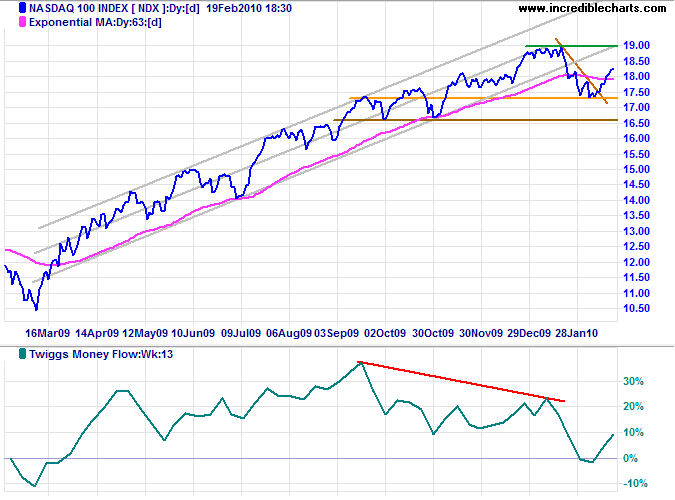
* Target calculation: 1900 + ( 1900 - 1750 ) = 2050
Canada: TSX
The TSX Composite broke through 11600 to signal a test of 12000. Twiggs Money Flow (13-week) recovery above the declining trendline indicates another primary advance. Breakout above 12000 would offer a target of 13000*. Reversal below 11000 is now unlikely, but would warn of a strong correction.
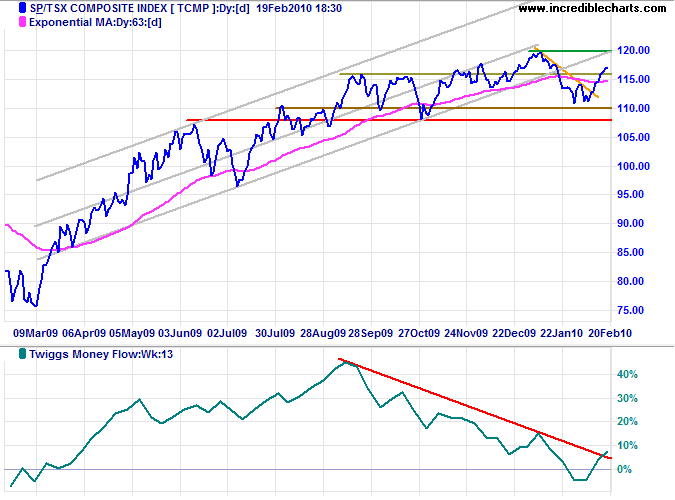
* Target calculation: 12000 + ( 12000 - 11000 ) = 13000
United Kingdom: FTSE
The FTSE 100 is headed for a test of 5600 after recovering above 5300; breakout would offer a target of 6200*. Twiggs Momentum (13-week) still shows long-term weakness, however, which would only be alleviated by recovery above 15%. Reversal below 5000 is now unlikely, but would indicate a strong correction.
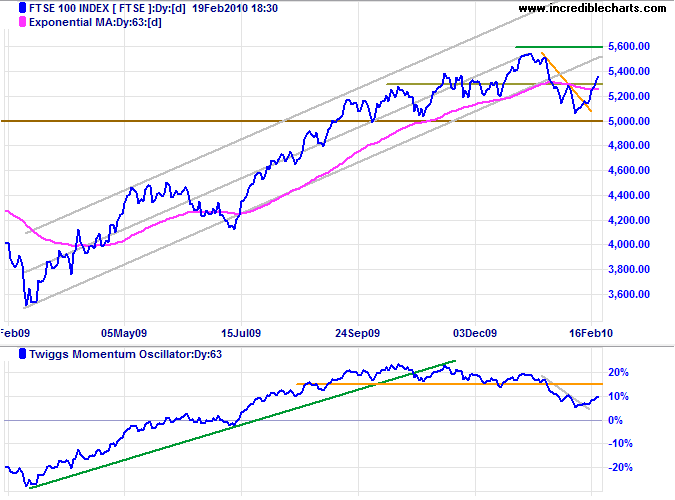
* Target calculation: 5600 + ( 5600 - 5000 ) = 6200
Germany: DAX
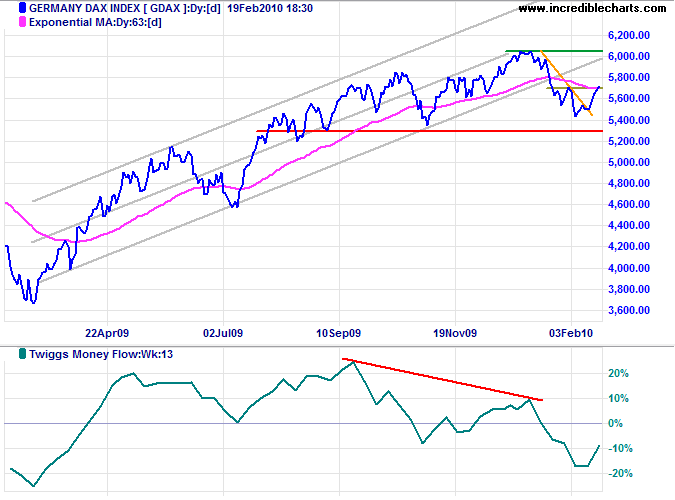
The DAX also shows signs of a recovery: rising above 5700. Twiggs Money Flow (13-week) breakout above the descending trendline would confirm this.
India: Sensex
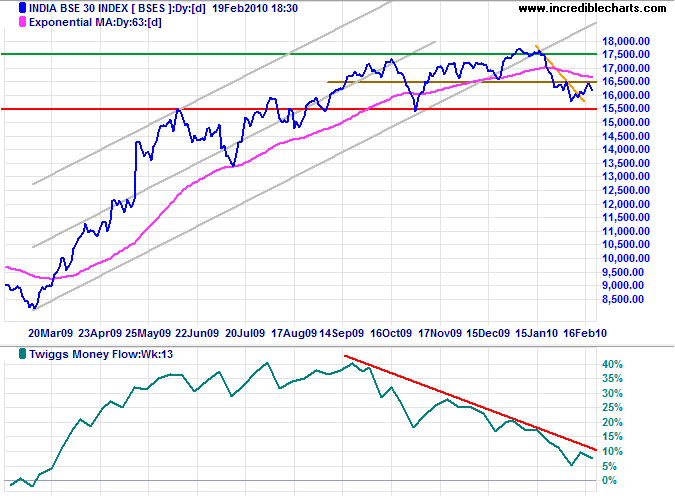
The Sensex met resistance at 16500 and is headed for another test of 15500. Respect of support would signal an end to the correction, while breakout would indicate a primary down-trend. Twiggs Money Flow (13-week) recovery above the declining trendline would highlight buying pressure.
Japan: Nikkei
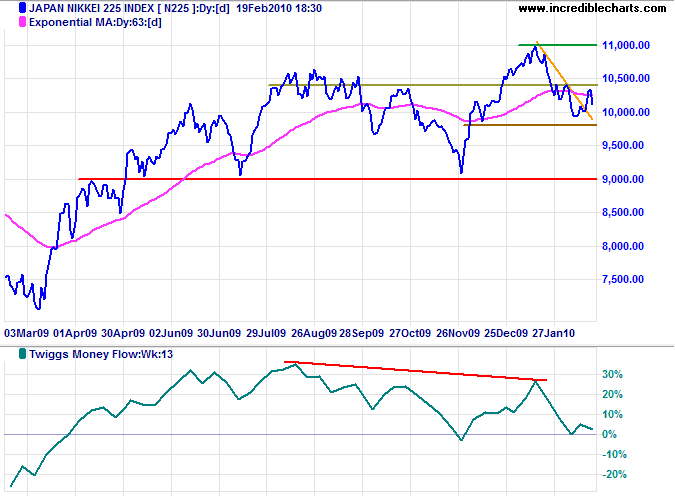
The Nikkei 225 closed at 10400 on Monday; breakout would indicate another test of 11000. Failure of 10000 is now unlikely, but would test primary support at 9000. Twiggs Money Flow (13-week) holding above zero indicates short-term support.
South Korea
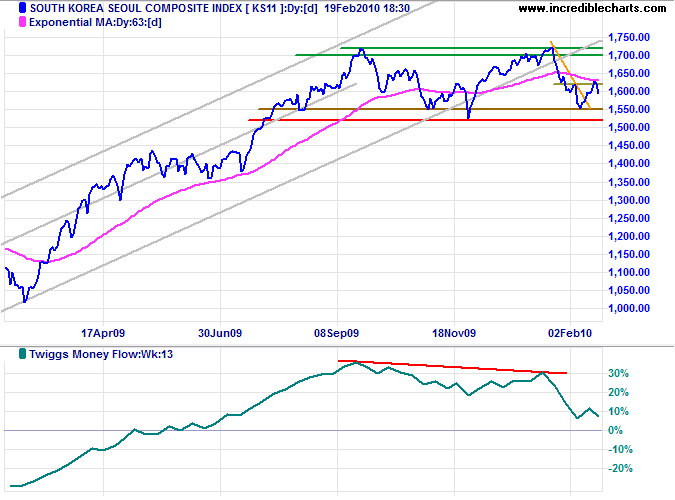
The Seoul Composite is again testing resistance at 1630 on Monday; breakout would signal another test of 1700/1720. Twiggs Money Flow (13-week) holding above zero indicates short-term buying support.
China
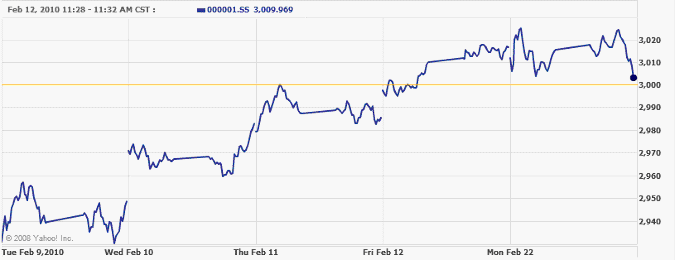
The Shanghai Composite Index resumed trading after closing last week for the Chinese New Year; testing its new support level after recovering above 3000. Reversal would signal a test of primary support at 2700, while breakout above 3050 would confirm that the correction has ended.
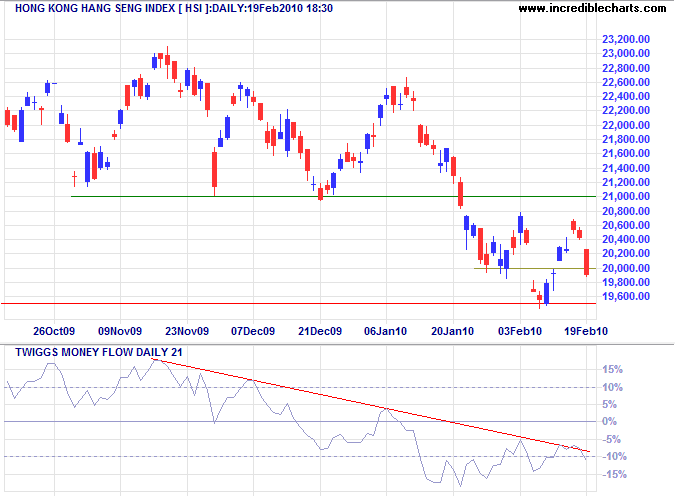
The Hang Seng Index found support at 20000 on Monday, gapping up to test short-term resistance at 20400. Recovery above 21000 would indicate that the primary down-trend is weakening. Twiggs Money Flow (21-day) holding below zero, however, warns otherwise.
Commodities & Precious Metals
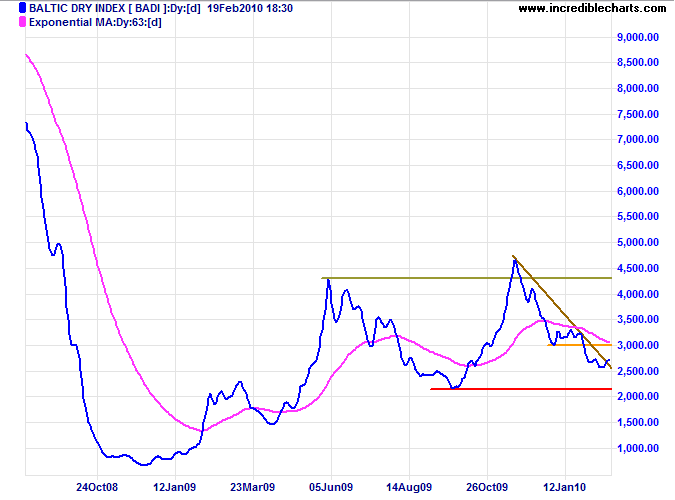
The Baltic Dry Index broke its descending trendline, indicating support at 2500. Respect of support would indicate that commodities and resources stocks are still in an, albeit very slow, primary up-trend.
Australia: ASX
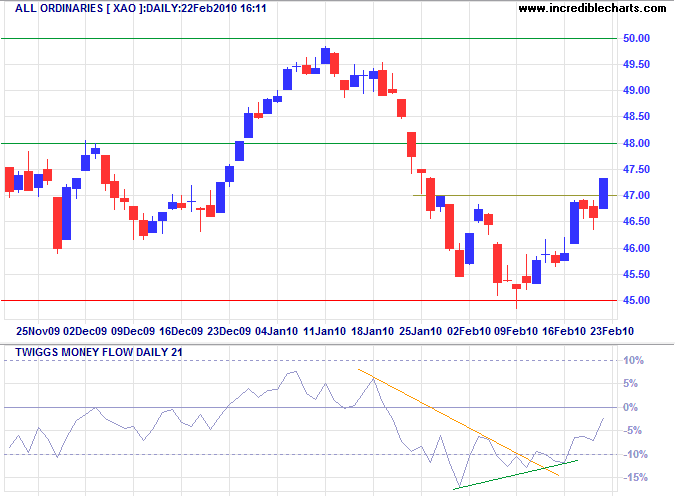
The All Ordinaries broke through 4700 to signal another test of 5000. Bullish divergence on Twiggs Money Flow (21-day) indicates buying pressure; recovery above zero would confirm the advance. Expect some resistance at 4800. Reversal through support at 4500 is unlikely, but would warn of a primary down-trend.
The ASX 200 is headed for a test of 5000 after breaking short-term resistance at 4650. Twiggs Money Flow (13-week) recovery above the descending trendline would confirm. The long-term picture, however, shows a bearish right-angled broadening wedge pattern; breakout below the base (at 4500) would offer a target of 4000*.
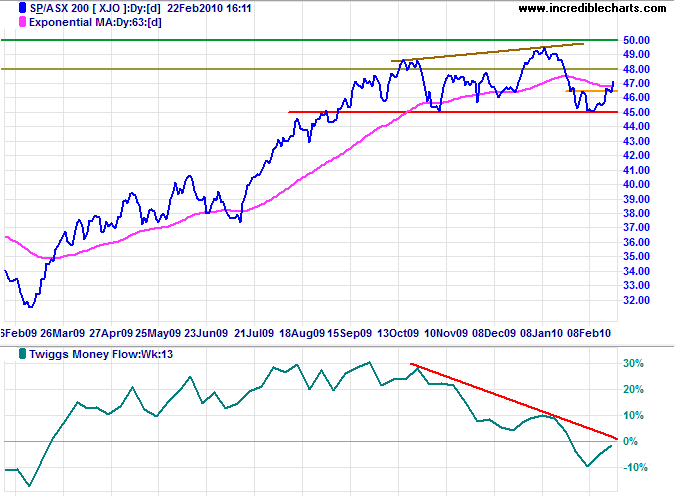
* Target calculation: 4500 - ( 5000 - 4500 ) = 4000
If the American people ever allow private banks to control the issue of their currency, first by inflation, then by deflation, the banks will deprive the people of all property until their children wake up homeless on the continent their fathers conquered. The issuing power should be taken from the banks and restored to the people, to whom it properly belongs.
~ Thomas Jefferson

Author: Colin Twiggs is a former investment banker with almost 40 years of experience in financial markets. He co-founded Incredible Charts and writes the popular Trading Diary and Patient Investor newsletters.
Using a top-down approach, Colin identifies key macro trends in the global economy before evaluating selected opportunities using a combination of fundamental and technical analysis.
Focusing on interest rates and financial market liquidity as primary drivers of the economic cycle, he warned of the 2008/2009 and 2020 bear markets well ahead of actual events.
He founded PVT Capital (AFSL No. 546090) in May 2023, which offers investment strategy and advice to wholesale clients.
