What's New: Stock Screens
By Colin Twiggs
January 6, 2010 3:00 a.m. ET (7:00 p.m. AET)
This newsletter is subject to Incredible Charts Terms of Use.
New Stock Screen Filters
The latest release offers a number of new stock screen filters, primarily for use in identifying breakouts and fast-trending stocks.
Twiggs Money Flow
Twiggs Money Flow is used to screen for stocks with strong buying or selling pressure. For example, screen for stocks where Twiggs Money Flow has been above the zero line for more than 20 days.

Twiggs Momentum Oscillator
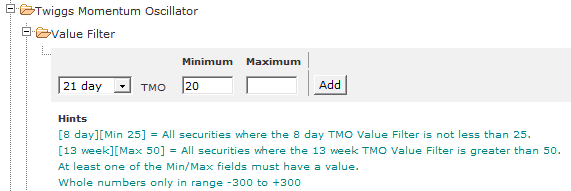
Twiggs Momentum is a new oscillator used to identify fast trending stocks. It offers a more consistent (smoother) curve than the typical Rate Of Change indicator. This example screens for stocks that have gained at least 20% in the past month.
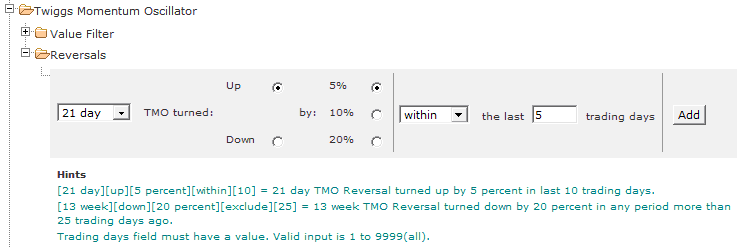
Twiggs Momentum Oscillator can also be used to generate buy and sell signals in a similar fashion to other momentum oscillators. Here we screen for stocks where the oscillator has turned up by at least 5% in the last 5 days.
Linear Regression
The key signal from the Linear Regression indicator is its slope. Upward slope indicates an up-trend and downward slope a down-trend. Here we use a 200-day Linear Regression to identify long-term up-trends: where Linear Regression has been sloping upwards for more than 5 days.

New Highs/New Lows
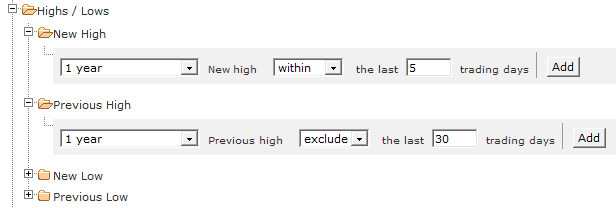
The Price heading includes a new set of filters to identify stocks making new highs or lows for a selected period. For example, you can now screen for new 3-month highs or new 1-year highs. You can also do the same with new lows. This example illustrates how to screen for stocks that have made a new 1-year high within the last 5 days.

Previous Highs/Lows
Under the same Price heading you will also notice filters for Previous Highs and Previous Lows. This enables you to screen specifically for breakouts from a base. Most stocks returned in a screen for New Highs are already in established up-trends. We need to add a second filter to isolate stocks where the New High is the first New High for some time. The example below filters for stocks that have made a recent new 1-year high, but excludes any where the Previous High was recorded in the last 30 days. The remaining stocks are likely to reflect a true breakout from a major base or consolidation.
Slow Stochastic: Value
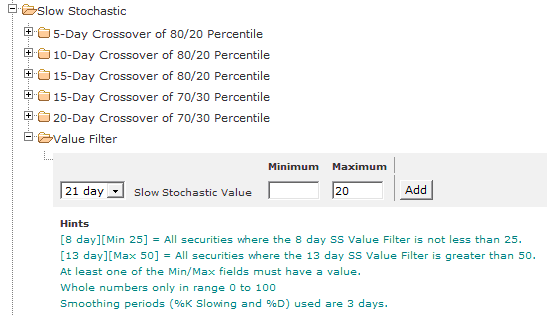
In addition to Slow Stochastic Crossovers, we have added a Value filter where you can screen for stocks where the Slow Stochastic is above/below a specified level. Traders often use this signal for early identification of potential reversals. Here we filter for stocks where Slow Stochastic is less than or equal to 20%.
Bollinger Band Width
Low Bollinger Band Width values are used to identify a Bollinger Band neck (or squeeze), where the bands converge before a sharp price movement. The new Band Width filter enables you to identify stocks where Band Width is, for example, below 5%.

Value Filter
We have also added a Value filter (in addition to the Volume filter) so you can screen for stocks where the value traded is greater than or equal to a specified minimum. Value is calculated as Volume x Closing Price. Options include screening for value traded on the latest day (Close) or an exponential moving average of Value. The example below screens for stocks where the 20-day moving average of Value is at least $1,000,000 (do not enter commas or $ symbols).

Free Users
New filters (apart from the Value Filter) will be available to all users until March 31st. Thereafter they will only be available to premium subscribers.
New Shared Stock Screens
I have created a number of example stock screens to demonstrate the power of the new filters. To access these screens:
- Open the Stock Screener by selecting View >> Stock Screens
- Select the Shared Screens tab
- Select one of the new screens from the list
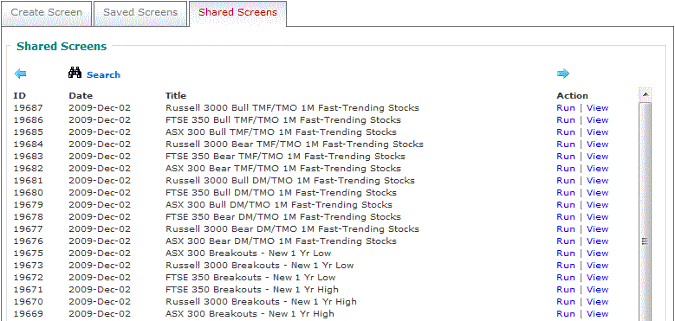
- The new screens are numbered from #19669 to #19687.
- Select View to examine or edit the filters; or select Run to display the results.
New Beta Version
The latest beta version contains several bug fixes, including Weekly and Monthly Linear Regression Lines & Channels, minor improvements to point and figure chart reversals, and a new indicator: Price Ratio (Unadjusted) for calculating the gold-oil and gold-dollar ratios. To receive the update, select Help >> Upgrade To Latest Beta Version on the chart menu.
Development Plans
We have expanded our development team and hope to report more frequent improvements to the charts, stock screener and data coverage in future. Thank you for all the suggestions and requests. While not all can be accommodated, the weight of requests guides us in setting new development priorities. Our revised priorities for the new year are:
| Development Priority | Estimated Completion* |
| Faster Chart Updates | 4 weeks |
| Stock Screens - Email and Incremental Updates | 6 weeks |
| Expanded Data Coverage | 8 weeks |
| Stock Screens - New Watchlists** | 12 weeks |
| Delayed Data (15/20 Minute)*** | 12 weeks |
| Hour & Minute Bars | 12 weeks |
* Estimated Completion is a rough guide only.
** Includes new watchlist import and export functions, editing tools and additional display fields such as sectors, industries, index components and latest prices.
*** Commencing with forex and precious metals
Success demands singleness of purpose.
~ Vince Lombardi.

Author: Colin Twiggs is a former investment banker with almost 40 years of experience in financial markets. He co-founded Incredible Charts and writes the popular Trading Diary and Patient Investor newsletters.
Using a top-down approach, Colin identifies key macro trends in the global economy before evaluating selected opportunities using a combination of fundamental and technical analysis.
Focusing on interest rates and financial market liquidity as primary drivers of the economic cycle, he warned of the 2008/2009 and 2020 bear markets well ahead of actual events.
He founded PVT Capital (AFSL No. 546090) in May 2023, which offers investment strategy and advice to wholesale clients.
