Debt Growth Points To Low Inflation
By Colin Twiggs
December 16, 2009 3:30 a.m. ET (7:30 p.m. AET)
These extracts from my trading diary are for educational purposes and should not be interpreted as investment or trading advice. Full terms and conditions can be found at Terms of Use.
US Debt Growth
The chart below shows growth in domestic non-financial debt (pink) up to the end of the third quarter. Financial debt is excluded because this would simply be double counting: the financial sector merely borrows from Peter and lends to Paul. We can see a sharp drop in the first half of 2008 as households and private corporations sold off assets and repaid debt in a falling market. The risk was a deflationary spiral as falling prices spark further sell-offs — which in turn cause further price falls.
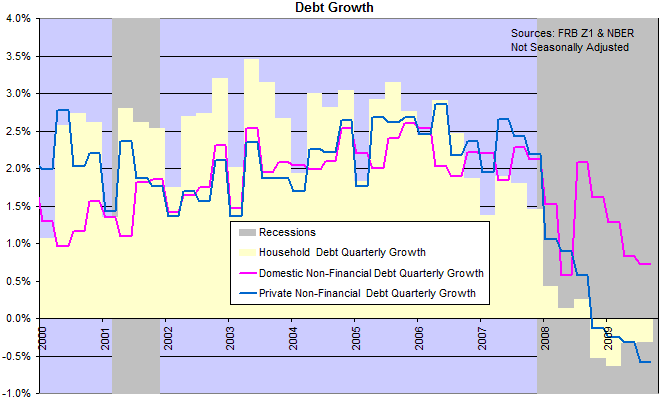
The sharp spike in domestic non-financial debt in the second half of 2008 reflects governement attempts to stimulate the economy and prevent a deflationary spiral — funded by increased borrowing. The gap between the pink and blue lines reflects growth in government (federal and state) debt. Private sector debt, however, continued falling — despite a slowing of the decline in household debt.
Debt growth is important because it reveals the level of inflationary pressure in the economy. And inflationary pressure indicates future interest rate policy. Between 2003 and 2008 domestic debt grew between 2% and 2.5% per quarter, or 8% and 10% annually. Subtract real GDP growth (pick a number between 0 and 2%) and what you have left is inflationary pressure. This had little effect on consumer prices (other than oil and gas), but had a massive impact on the housing market — fueling the recent bubble.
The 2009 rise in Treasury debt has been offset by falling private sector borrowing — and rising government debt is unsustainable, without risking hyper-inflation. Overall domestic debt levels are likely to fall — and inflationary pressures ease as a result. Expect the Fed to maintain low interest rates until there is an up-turn in private investment and borrowing — which may be some way off.
With low interest rates and low inflation, downward pressure on the dollar is limited; and upward pressure on gold. Demand for gold is a bet on continued growth in government debt — fueling rising inflation, but the alternative scenario of low growth and higher taxes is just as likely.
US Dollar Index
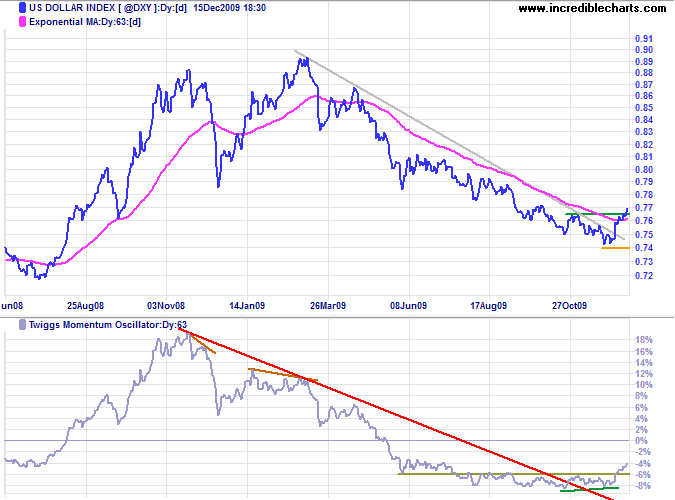
The US Dollar Index broke through resistance at 76.6, signaling that the primary down-trend has ended. So far no higher low (trough) has formed, but bullish divergence on the Momentum Oscillator indicates an up-trend.
Gold
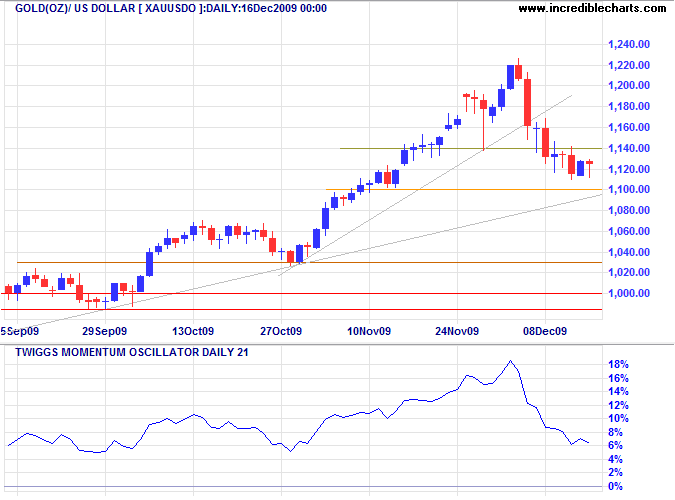
Spot gold is testing medium-term support and the rising trendline at $1100. Failure of support would offer a target of $1000*. Recovery above $1140 is less likely, but would indicate a short rally in the downward correction.
Source: Netdania
* Target calculation: 1100 - ( 1200 - 1100 ) = 1000
Silver
Spot silver is also testing its rising trendline — and medium-term support at $17. Failure would indicate a test of $16. Bearish divergence on the Momentum Oscillator indicates the up-trend is weakening — and penetration of $16 would complete a bearish ascending (right-angled) broadening wedge formation with a target of $13*.
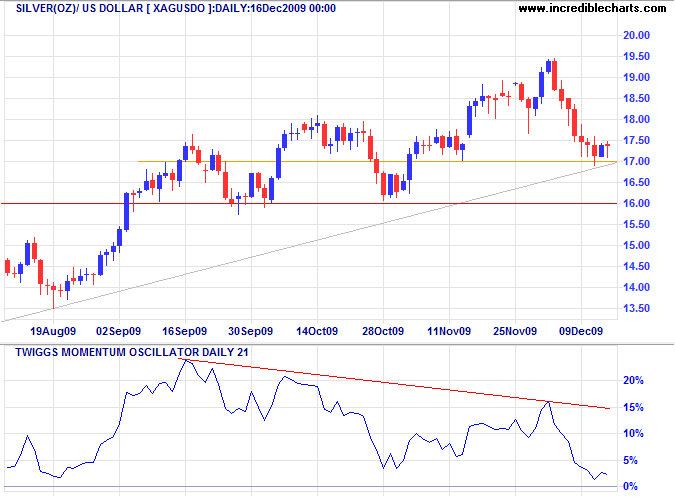
* Target calculation: 16 - ( 19 - 16 ) = 13
Crude Oil
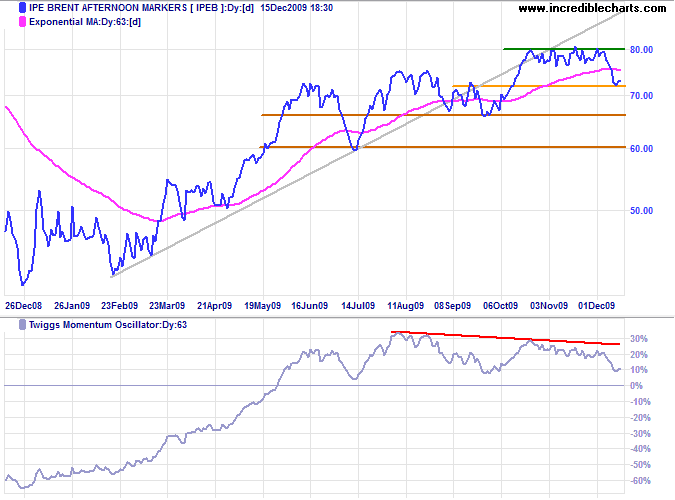
Crude oil also reflects slowing momentum, with both a trendline break and bearish divergence on the Momentum Oscillator (63-day). Failure of support at $66 would signal a primary trend reversal, while recovery above $80 would indicate an advance to $90*.
Source: Netdania
* Target calculation: 80 + ( 80 - 70 ) = 90
Help to keep this newsletter free! Forward this link to friends and colleagues
![]()
The Japanese government did choose to let the corporate sector earn its way back, first by preventing bankruptcies and second by stimulating demand. To achieve the first goal, the government kept interest rates near zero and Japanese banks did not pursue mark-to-market accounting in assessing borrower solvency. With a big chunk of the corporate sector zombie-like, the economy, of course, was always facing downward pressure. The government had to run large fiscal deficits to prop up the economy. After the bubble, Japan's economic equilibrium stagnated and the fiscal deficit swelled.
~ Andy Xie:
What We Can Learn as Japan's Economy Sinks

Author: Colin Twiggs is a former investment banker with almost 40 years of experience in financial markets. He co-founded Incredible Charts and writes the popular Trading Diary and Patient Investor newsletters.
Using a top-down approach, Colin identifies key macro trends in the global economy before evaluating selected opportunities using a combination of fundamental and technical analysis.
Focusing on interest rates and financial market liquidity as primary drivers of the economic cycle, he warned of the 2008/2009 and 2020 bear markets well ahead of actual events.
He founded PVT Capital (AFSL No. 546090) in May 2023, which offers investment strategy and advice to wholesale clients.
