Fedex Up But Bulk Shipping Down
By Colin Twiggs
December 14, 2009 8:00 p.m. ET (12:00 midday AET)
These extracts from my trading diary are for educational purposes and should not be interpreted as investment or trading advice. Full terms and conditions can be found at Terms of Use.
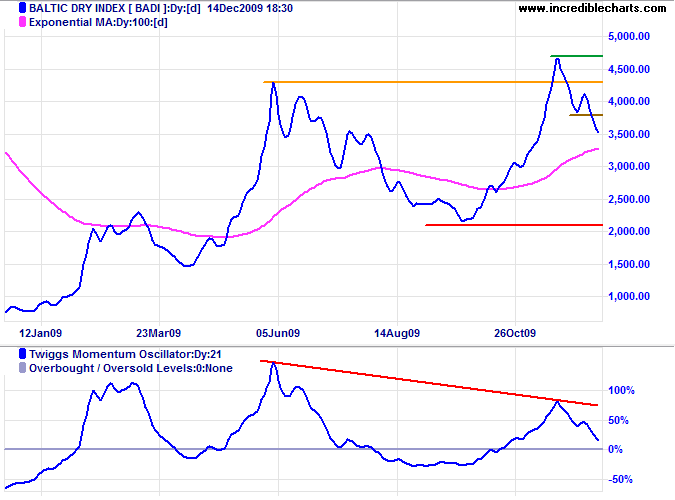
We have mixed signals this week, with Fedex ready for a take-off, but the Baltic Dry Index is faltering. Reflecting international bulk shipping rates, the index reversed below support at 4300 after a marginal break to a new high. Falling Momentum warns that the primary up-trend is weakening. Declining shipments of bulk commodities are a bearish sign for China (the primary customer) and global resources stocks.
Fedex & Transport
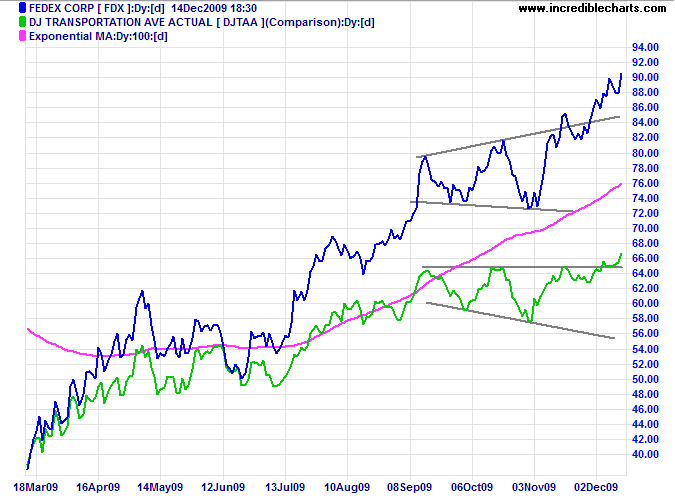
Fedex broke out above its bullish broadening wedge formation after lifting earnings guidance for the fiscal second quarter to $1.10 per share from an expected 85 cents (TheStreet). This is a positive sign for the broader US economy and is supported by a similar breakout of the Dow Transport Average from a bullish (descending) broadening wedge pattern.
USA
Dow Jones Industrial Average
The Dow continues to consolidate between 10250 and 10500; breakout will indicate future direction. Twiggs Money Flow (21-day) likewise displays a triangle, with rising and falling trendlines. Again, breakout will indicate future direction. In the long term, upward breakout from the ascending wedge formation would offer a target of 12000*, while downward breakout would test support at the base of 9000.
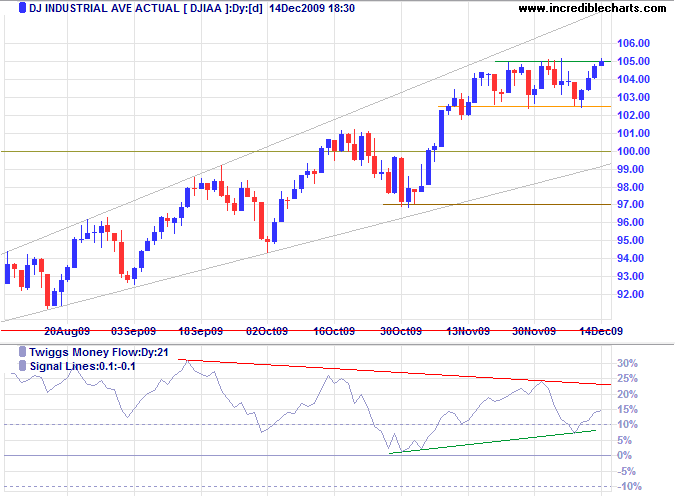
* Target calculation: 10500 + ( 10500 - 9000 ) = 12000
S&P 500
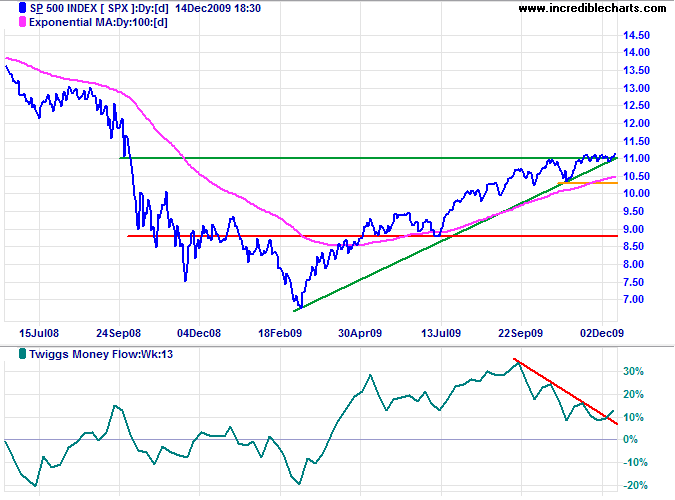
The S&P 500 is testing resistance at the upper border of its recent consolidation around resistance at 1100. Twiggs Money Flow (13-week) recovery above its declining trendline indicates easing selling pressure. Breakout above 1120 would signal a further primary advance. Reversal below the rising trendline is now unlikely, but would warn of a secondary correction — confirmed if support at 1030 fails.
Technology
The Nasdaq 100 is consolidating between 1740 and 1810, below the upper border of the bearish (right-angled ascending) broadening wedge formation. Upward breakout from the wedge would indicate a primary advance to 1950*. Twiggs Money Flow (21-day) displays a triangle, with rising and falling trendlines: breakout will indicate future direction. Failure of support at 1650 is unlikely, but would offer a target of 1500*.
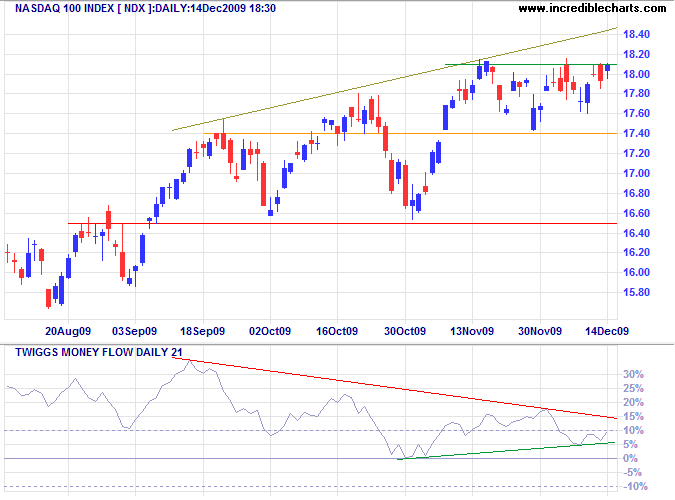
* Target calculation: 1650 - ( 1800 - 1650 ) = 1500 and 1800 + ( 1800 - 1650 ) = 1950
Canada: TSX
The TSX Composite retreated below the new support level at 11600, signaling a false breakout and test of support at 11000. Declining Twiggs Money Flow (13-week) and Momentum Oscillator warn of selling pressure. Breakout below 10800 would signal a secondary correction, while reversal above 11600 would indicate a primary advance to 12400*.
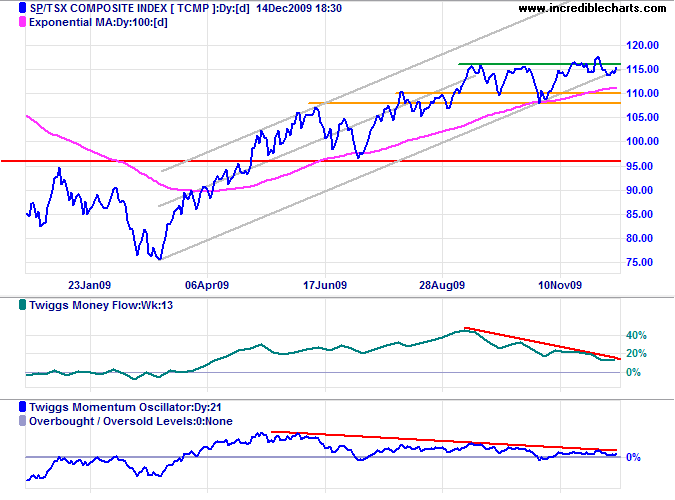
* Target calculation: 11600 + ( 11600 - 10800 ) = 12400
United Kingdom: FTSE
The FTSE 100 Index is headed for another test of resistance at 5400. The right-angled ascending broadening wedge is a bearish formation, warning of a correction to 4600*. Twiggs Money Flow (21-day) formed another triangle: breakout will indicate future direction. Upward breakout from the ascending wedge would signal an advance to 5800*.
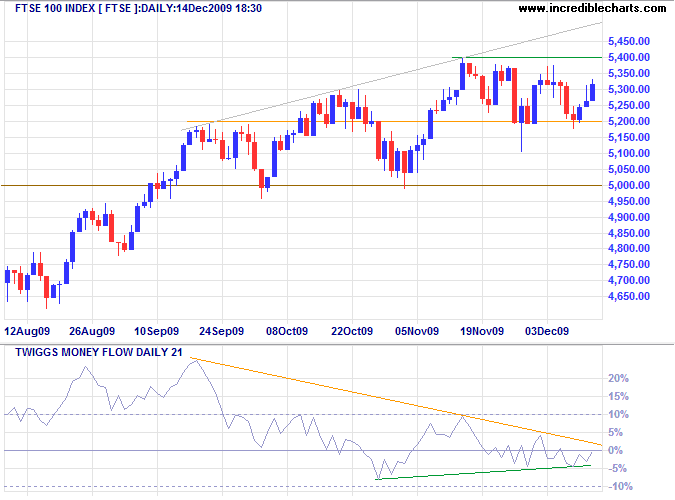
* Target calculation: 5000 - ( 5400 - 5000 ) = 4600 and 5400 + ( 5400 - 5000 ) = 5800
Germany: DAX
The DAX is headed for another test of resistance at 5850/5900. Upward breakout would offer a target of 6500*. Twiggs Money Flow (21-day) formed yet another triangle: breakout will indicate future direction. Reversal below 5600 would warn of another correction, while failure of support at 5300 would signal a primary trend reversal.
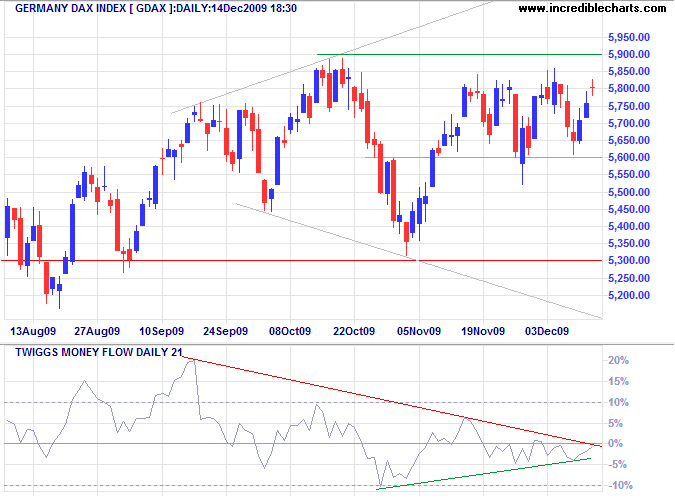
* Target calculation: 5900 +( 5900 - 5300 ) = 6500
India: Sensex
The Sensex is consolidating below resistance at 17300; upward breakout would signal an advance to 20000*. Bearish divergence on Twiggs Money Flow (21-day), however, indicates selling pressure. Reversal below 17000 would test 16600; and breakout below 16600 would warn of a secondary correction. In the long term, failure of support at 15400 would signal a primary trend reversal.
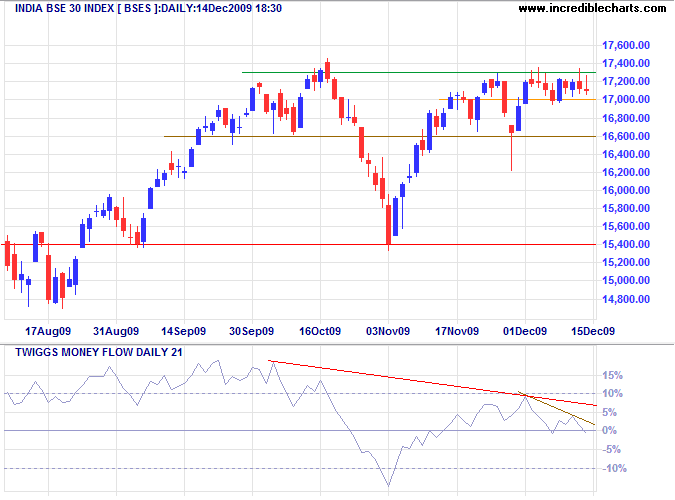
* Target calculation: 17500 + ( 17500 - 15000 ) = 20000
Japan: Nikkei
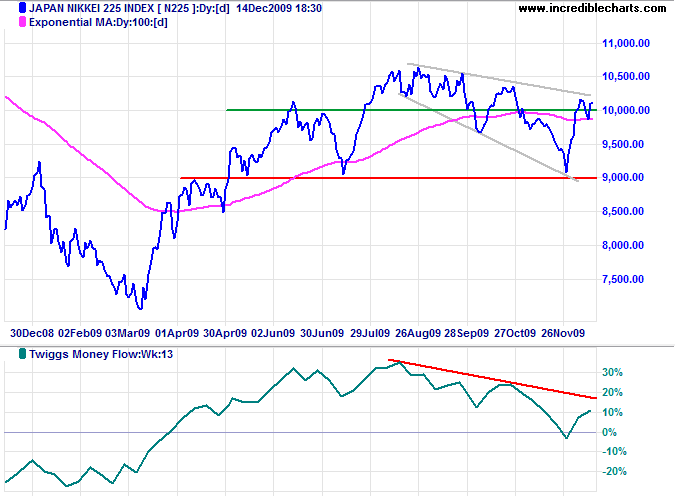
The Nikkei 225 displays a large descending broadening wedge pattern, favoring continuation of the primary up-trend. Breakout above 10200 would offer a target of 10600 — the base of the formation. Twiggs Money Flow (13-week), however, continues to reflect selling pressure.
South Korea
The Seoul Composite is headed for a test of resistance at 1720. Rising Twiggs Money Flow (21-day) indicates buying pressure. Breakout above 1720 would signal a primary advance to 1940*.
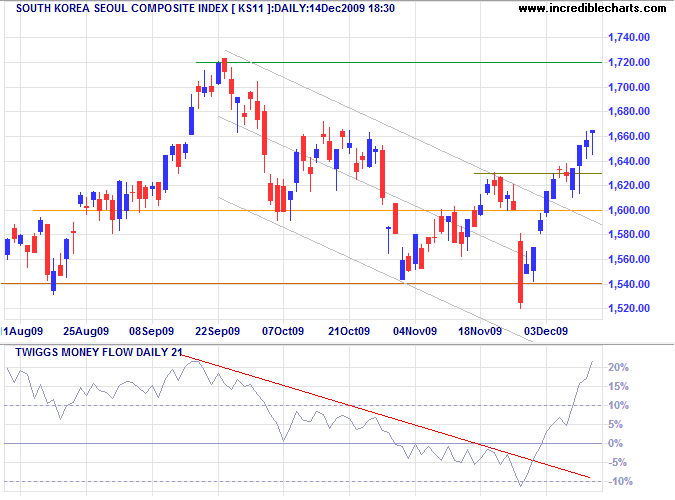
* Target calculation: 1720 + ( 1720 - 1520 ) = 1940
China
The Shanghai Composite Index is testing resistance at 3350. Declining Twiggs Money Flow (13-week) indicates selling pressure, but Momentum has formed a triangle, indicating consolidation. Breakout above 3350 would test 3500, while reversal below the rising trendline would warn of a correction to 2700 — confirmed if support at 3100 is broken. In the long term, breakout above 3500 would offer a target of 4300*.
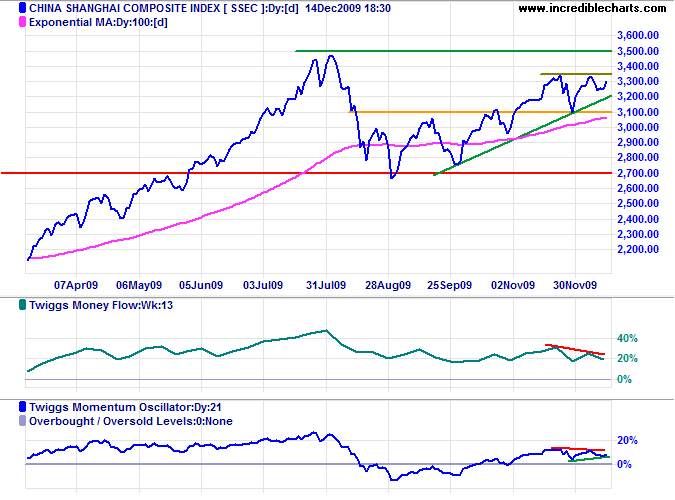
* Target calculations: 3500 + ( 3500 - 2700 ) = 4300
The Hang Seng Index declining Twiggs Money Flow (13-week) and Momentum Oscillator (21-day), indicate a weakening up-trend. Failure of support at 21000 would signal a primary down-trend, while breakout above 23000 would offer a target of 25000*.
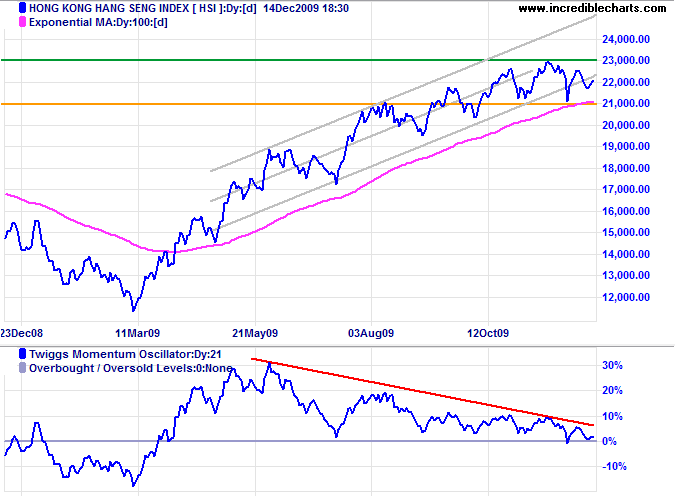
* Target calculation: 23000 + ( 23000 - 21000 ) = 25000
Australia: ASX
The All Ordinaries found support at 4600 and is rallying to test resistance at 4800. Twiggs Money Flow (21-day) recovery above zero would signal buying pressure. Breakout above 4800 would test the key resistance level at 5000*, while failure of support at 4600 would warn of a secondary correction — confirmed if 4500 is penetrated.
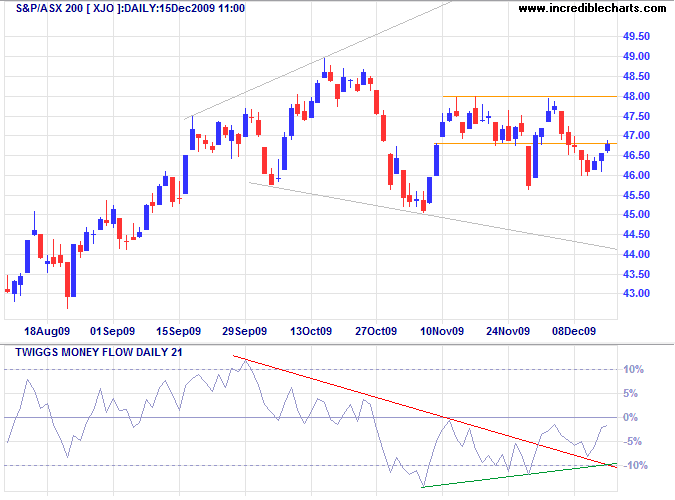
* Target calculation: 5000 + ( 5000 - 4000 ) = 6000
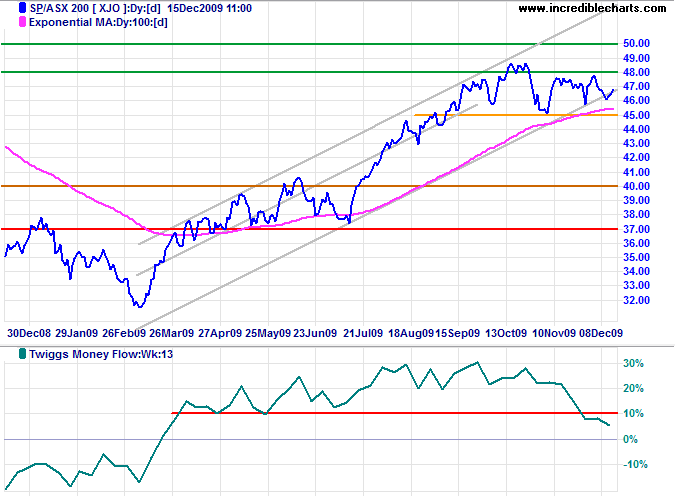
Declining Twiggs Money Flow (13-week) on the ASX 200 continues to warn of selling pressure. Failure of support at 4500 would signal a secondary correction. In the longer term, resource stocks will be adversely affected if the Baltic Dry Index reverses to a down-trend.
Help to keep this newsletter free! Forward this link to friends and colleagues
![]()
In truth, the only difference between those who have failed and those who have succeeded lies in the difference of their habits. Good habits are the key to all success. Bad habits are the unlocked door to failure. Thus, the first law I will obey, which precedes all others, is--"I will form good habits and become their slaves."
~ Og Mandino

Author: Colin Twiggs is a former investment banker with almost 40 years of experience in financial markets. He co-founded Incredible Charts and writes the popular Trading Diary and Patient Investor newsletters.
Using a top-down approach, Colin identifies key macro trends in the global economy before evaluating selected opportunities using a combination of fundamental and technical analysis.
Focusing on interest rates and financial market liquidity as primary drivers of the economic cycle, he warned of the 2008/2009 and 2020 bear markets well ahead of actual events.
He founded PVT Capital (AFSL No. 546090) in May 2023, which offers investment strategy and advice to wholesale clients.
