Employment Numbers Excite Market
By Colin Twiggs
December 7, 2009 4:00 a.m. ET (8:00 p.m. AET)
These extracts from my trading diary are for educational purposes and should not be interpreted as investment or trading advice. Full terms and conditions can be found at Terms of Use.
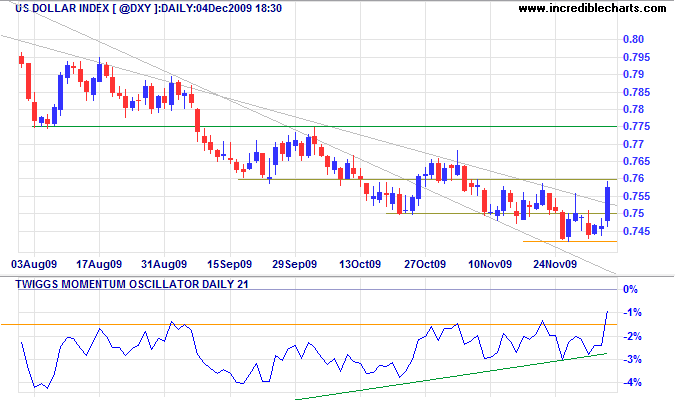
The US Dollar jumped sharply on the strength of the November jobs report, unemployment falling from 10.2 to 10.0 percent. Even long-term unemployment figures, which include those who have given up looking for work, improved from 17.5 to 17.2 percent (NYTimes). Expectation that interest rates may rise sooner than previously anticipated caused the US Dollar Index to rally to 76. Upward breakout, supported by the bullish divergence on Momentum Oscillator would indicate that the down-trend is weakening.
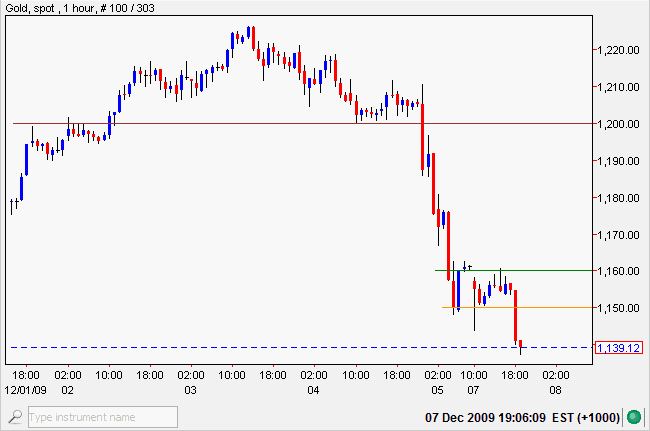
The sharp jump in the dollar caused a reciprocal drop in the gold price. Support at $1150 failed to hold. Narrow consolidation on the hourly chart, between $1150 and $1160, signals continuation of the down-trend, offering a target of $1075*, while upward breakout would test resistance at $1200.
Source: Netdania
* Target calculation: 1150 - ( 1225 - 1150 ) = 1075
One swallow does not make a summer. The dollar remains in a down-trend and gold in a primary up-trend. Resumption of the runaway trend of the last few months is not expected after markets have been spooked by the sharp correction, but there is insufficient evidence to make a strong case for a primary trend reversal.
Commodities
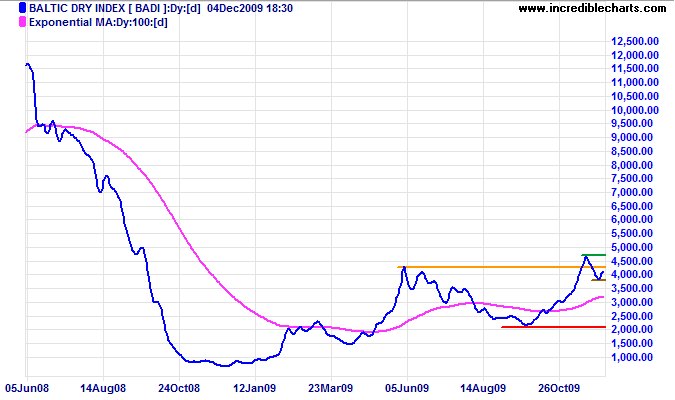
The Baltic Dry Index is in a primary up-trend, indicating that international shipments of bulk commodities are recovering. A positive long-term sign for commodity prices and resources stocks.
USA
Dow Jones Industrial Average
The Dow continues to consolidate below 10500, at the upper border of a bearish ascending broadening wedge formation. Expect a down-swing to test the lower border at 10000. Broader wedges (with a megaphone appearance) are more reliable than narrower (telescope-style) wedges, but downward breakout would signal a correction back to the base of the wedge at 9000. Bearish divergence on Twiggs Money Flow (13-week) reinforces the signal. Upward breakout from the formation is unlikely, but would offer a target of 12000*
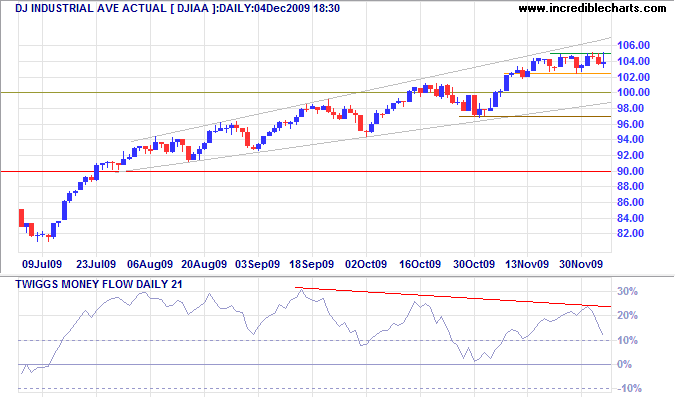
* Target calculation: 10500 + ( 10500 - 9000 ) = 12000
S&P 500
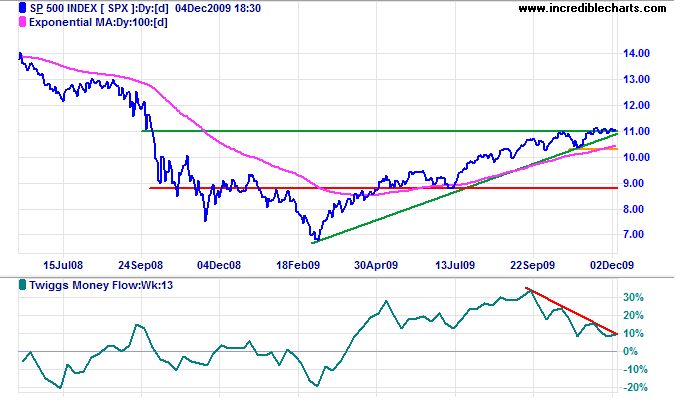
The S&P 500 continues to whipsaw around resistance at 1100. Reversal below the rising trendline would warn of a secondary correction. Failure of support at 1030 would confirm. Bearish divergence on Twiggs Money Flow (13-week) signals selling pressure.
Transport
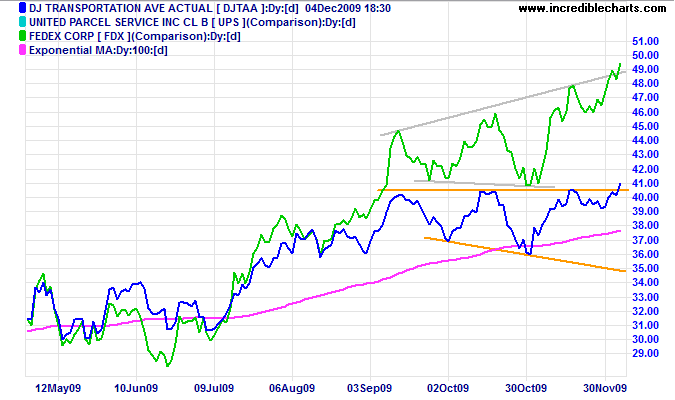
The Dow Transport Average and Fedex completed bullish broadening wedges, signaling a primary advance.
Technology
The Nasdaq 100 is consolidating below the upper border of the bearish broadening wedge formation (right-angled ascending). Upward breakout would indicate a primary advance to 1950*. Bearish divergence on Twiggs Money Flow (13-week), however, signals selling pressure, and failure of support at 1650 would offer a target of 1500*.
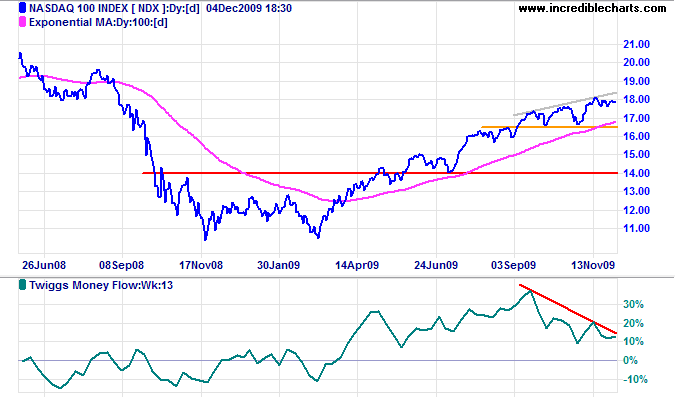
* Target calculation: 1650 - ( 1800 - 1650 ) = 1500 and 1800 + ( 1800 - 1650 ) = 1950
Canada: TSX
The TSX Composite broke through resistance at 11600, signaling an advance to 12400*. Rising Twiggs Money Flow (21-day) confirms the signal.
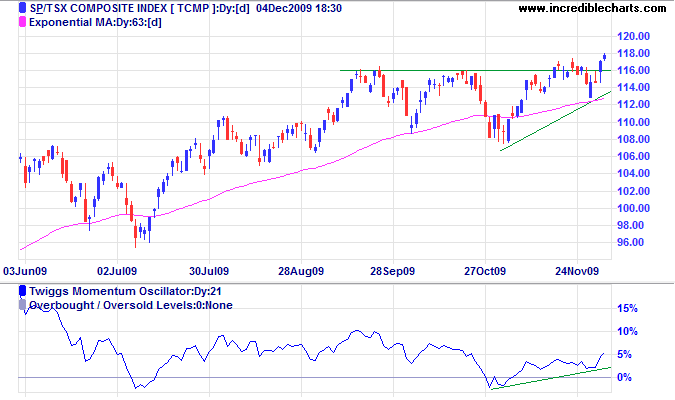
* Target calculation: 11600 + ( 11600 - 10800 ) = 12400
United Kingdom: FTSE
The FTSE 100 Index is consolidating between 5200 and 5400. The right-angled ascending broadening wedge warns of a correction to 4600* — as does bearish divergence on Twiggs Money Flow (21-day). Upward breakout is less likely, but would signal an advance to 5800*.
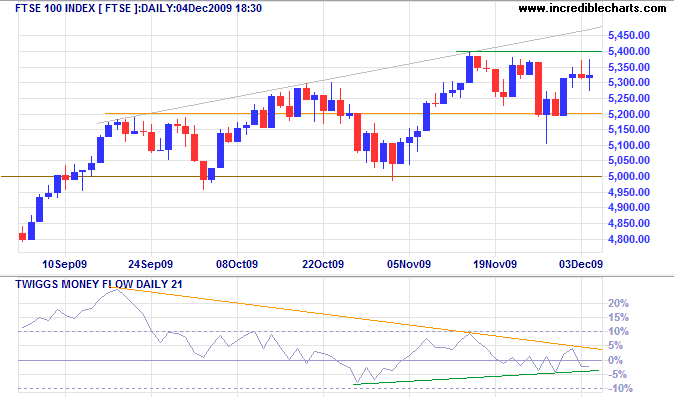
* Target calculation: 5000 - ( 5400 - 5000 ) = 4600 and 5400 + ( 5400 - 5000 ) = 5800
Germany: DAX
The DAX is again testing resistance at 5850. Upward breakout from the ascending triangle would offer a target of 6300*. Bearish divergence on Twiggs Money Flow (21-day), however, continues to warn of selling pressure; breakout below 5600 would warn of a secondary correction.
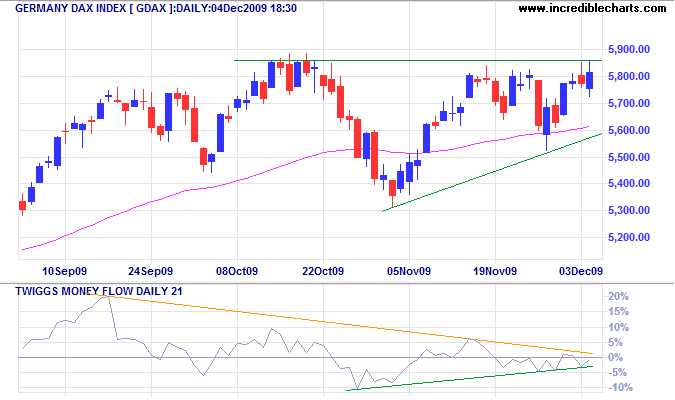
* Target calculation: 5800 +( 5800 - 5300 ) = 6300
India: Sensex
The Sensex encountered resistance at 17300 and is headed for a test of support at 17000 on Monday. Bearish divergence on Twiggs Money Flow (13-week) warns of selling pressure; failure of support at 16500 would signal a secondary correction. Breakout above 17500 is less likely, but would offer a target of 20000*.
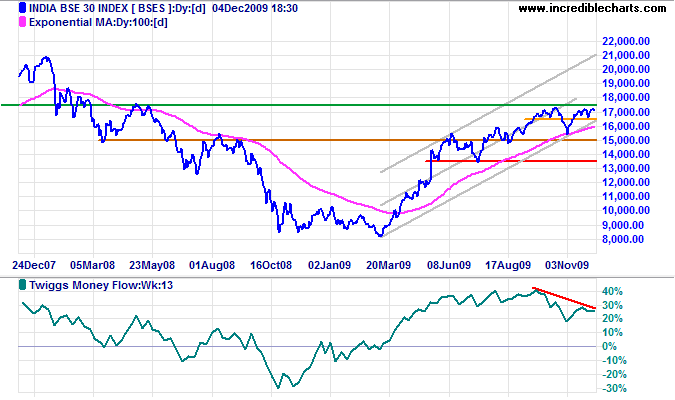
* Target calculation: 17500 + ( 17500 - 15000 ) = 20000
Japan: Nikkei
The Nikkei 225 rallied strongly, interest in exporters ignited by the weaker yen. Twiggs Money Flow continues to indicate selling pressure. Monday opened above 10000, however, indicating a test of the upper border of the large (descending) broadening wedge pattern. Upward breakout would offer a target of 11600*.
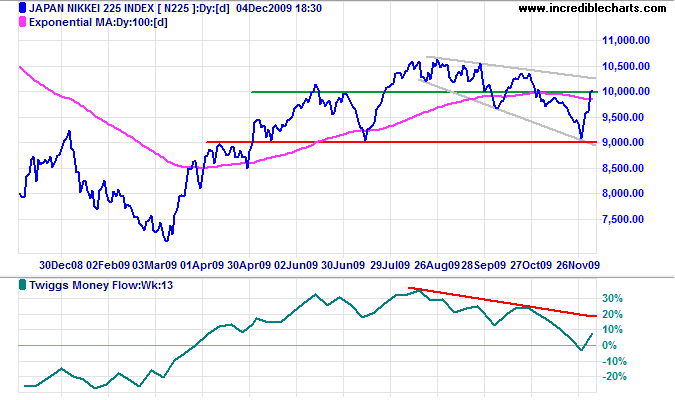
* Target calculation: 10300 + ( 10300 - 9000 ) = 11600
South Korea
The Seoul Composite opened above 1630 and consolidated above this level throughout Monday, signaling an end to the secondary correction. Rising Twiggs Money Flow (21-day) indicates buying pressure. The primary advance offers a target of 1940*.
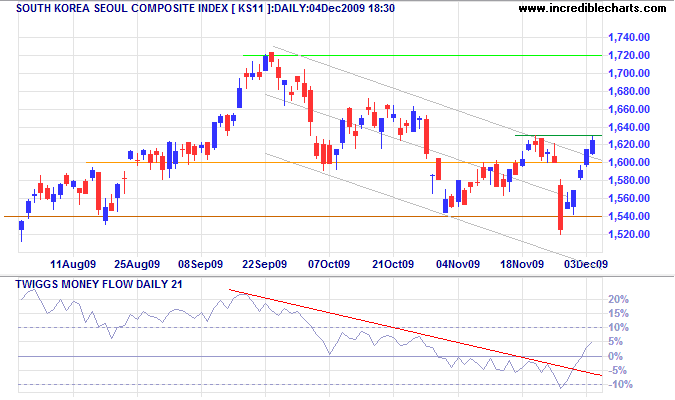
* Target calculation: 1720 + ( 1720 - 1520 ) = 1940
China
The Shanghai Composite Index is headed for a test of 3500, but bearish divergence on Twiggs Money Flow (13-week) indicates selling pressure. Upward breakout would offer a target of 4300*, while respect of resistance would indicate a test of support at 2700.
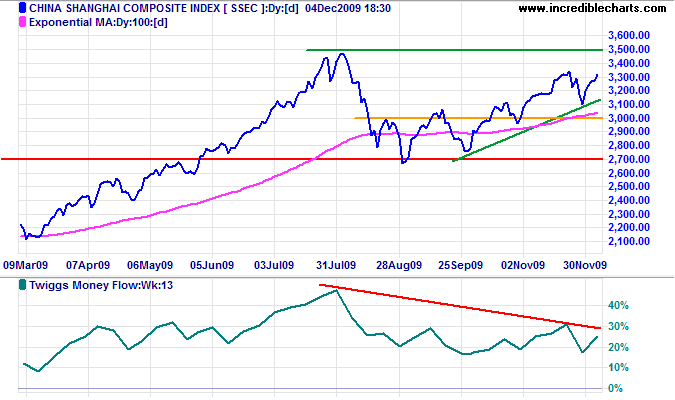
* Target calculations: 3500 + ( 3500 - 2700 ) = 4300
The Hang Seng Index is headed for a test of 23000. Twiggs Money Flow (13-week) holding high above zero indicates buying pressure. Upward breakout would offer a target of 25000*; reversal below support at 21000 is unlikely, but would warn of a primary down-trend.
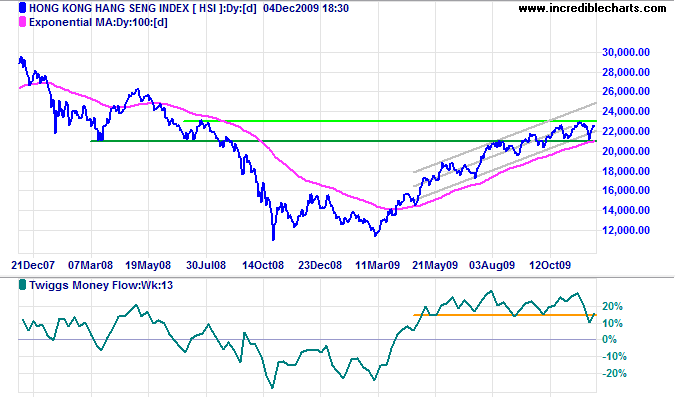
* Target calculation: 23000 + ( 23000 - 21000 ) = 25000
Australia: ASX
The All Ordinaries again penetrated support at 4700; follow-through tomorrow would indicate a failed up-swing, warning of a downward breakout from the broadening wedge formation. Twiggs Money Flow (21-day) holding below zero warns of selling pressure. Failure of support at 4500 would confirm a secondary correction. Reversal above 4800 is less likely, but would test the key resistance level at 5000*.
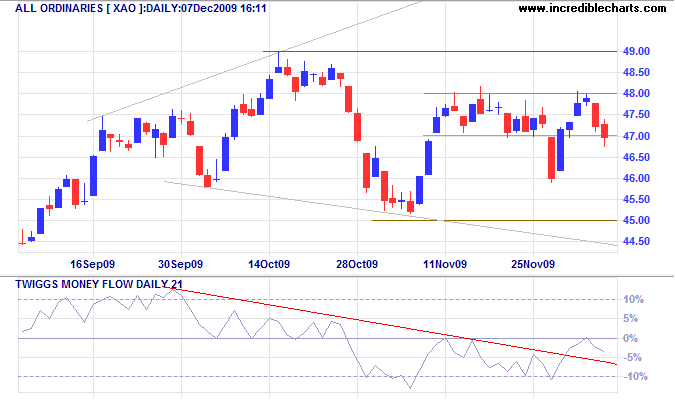
* Target calculation: 5000 + ( 5000 - 4000 ) = 6000
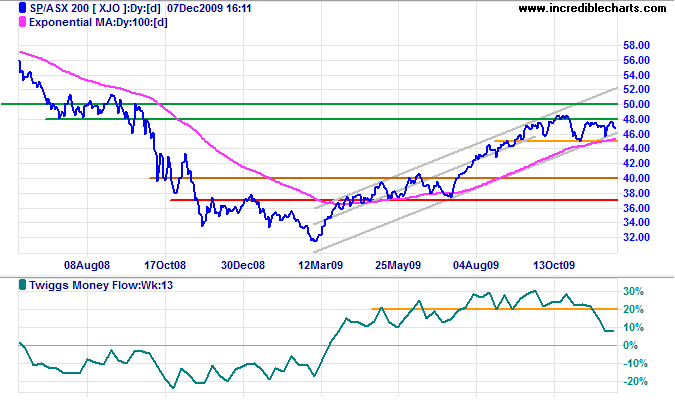
The ASX 200 is also headed for a test of support at 4500. Declining Twiggs Money Flow (13-week) warns of selling pressure. Failure of support would signal a secondary correction. A stronger US dollar would cause the reversal of carry trades, increasing downward pressure on the Australian dollar and stocks.
Help to keep this newsletter free! Forward this link to friends and colleagues
![]()
Like a baseball game, wars are not over till they are over. Wars don't run on a clock like football. No previous generation was so hopelessly unrealistic that this had to be explained to them.
~ Thomas Sowell

Author: Colin Twiggs is a former investment banker with almost 40 years of experience in financial markets. He co-founded Incredible Charts and writes the popular Trading Diary and Patient Investor newsletters.
Using a top-down approach, Colin identifies key macro trends in the global economy before evaluating selected opportunities using a combination of fundamental and technical analysis.
Focusing on interest rates and financial market liquidity as primary drivers of the economic cycle, he warned of the 2008/2009 and 2020 bear markets well ahead of actual events.
He founded PVT Capital (AFSL No. 546090) in May 2023, which offers investment strategy and advice to wholesale clients.
