Gold Breaks $1100 As Dollar Falls
By Colin Twiggs
November 9, 2009 10:00 p.m. ET (2:00 p.m. AET)
These extracts from my trading diary are for educational purposes and should not be interpreted as investment or trading advice. Full terms and conditions can be found at Terms of Use.
US Dollar Index
The US Dollar Index is testing support at 75. Breakout would signal a decline to 74*. In the long term, the dollar is headed for its 2008 low of 71. Breakout above 76.50 is unlikely, but would warn that the down-trend is ending.
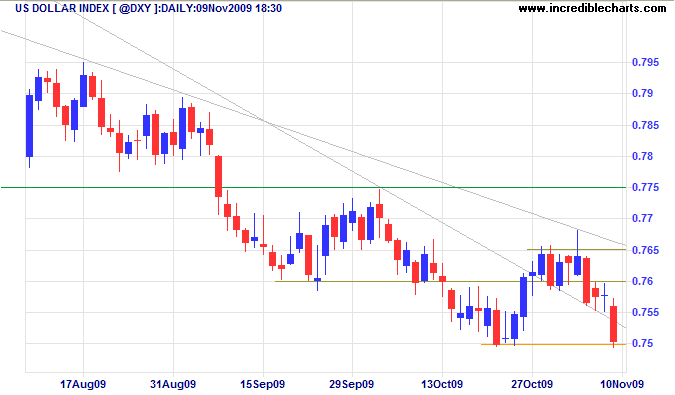
* Target calculation: 75 - ( 76 - 75 ) = 74
Gold
Spot gold reached its short-term target of $1100*. Expect retracement to test the new support level at $1070. The long-term target for the primary advance is $1300*. Reversal below the rising trendline is most unlikely, but would warn of trend weakness.
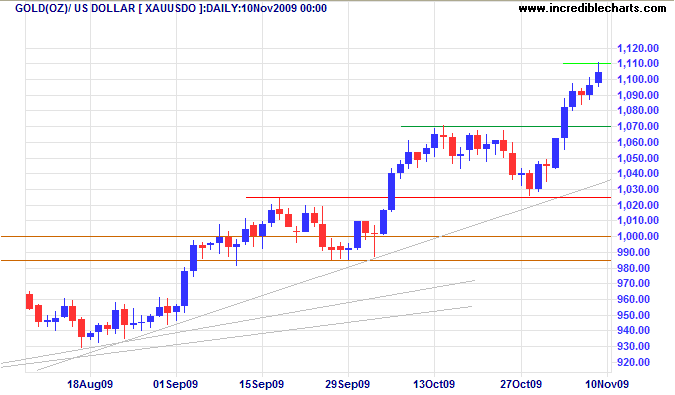
* Target calculations: 1000 + ( 1000 - 900 ) = 1100 and 1000 + ( 1000 - 700 ) = 1300
Gold miners are lagging rather than leading the spot metal price. The Market Vectors Gold Miners Index [GDX] formed a broadening wedge continuation pattern. Breakout above the upper channel would offer a target of $58*.
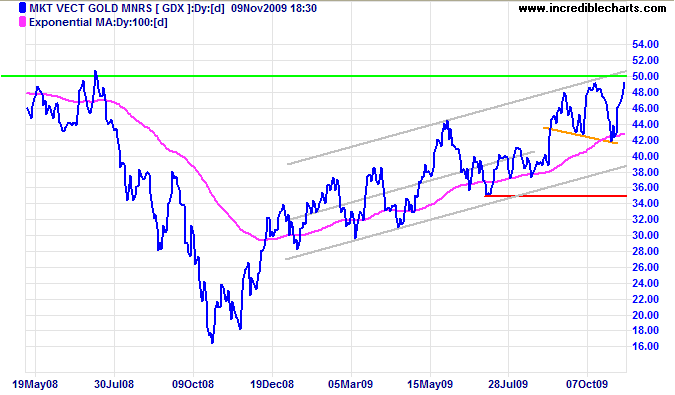
* Target calculation: 50 + ( 50 - 42 ) = 58
Silver
Spot silver also displays a broadening wedge (right-angled ascending) continuation pattern. Breakout above the upper trend channel would offer a target of the March 2008 high of $21*. Respect of resistance at $18 is unlikely, but would warn of correction to the lower trend channel.
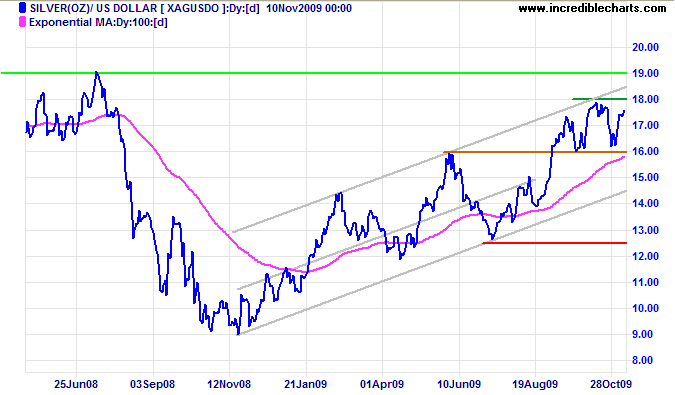
* Target calculation: 18.50 + ( 18.50 - 16 ) = 21
Platinum
Platinum is edging cautiously upward. Breakout above $1360 would offer a target of $1420*. Reversal below the lower trend channel remains unlikely, but would warn that the primary up-trend is weakening.
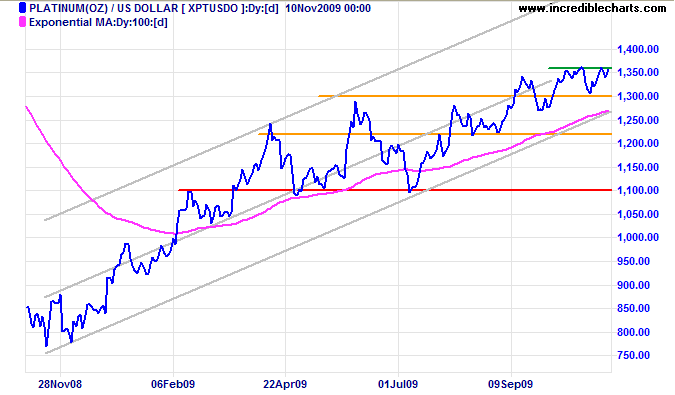
* Target calculations: 1360 + ( 1360 - 1300 ) = 1420
Crude Oil
Crude oil is also edging up cautiously. Narrow consolidation is a bullish sign and breakout above $80 would signal an advance to $84*. Reversal below $76, however, would test the rising trendline at $72. In the long term, the next resistance level is at $90, while failure of primary support at $66 would signal a trend reversal.
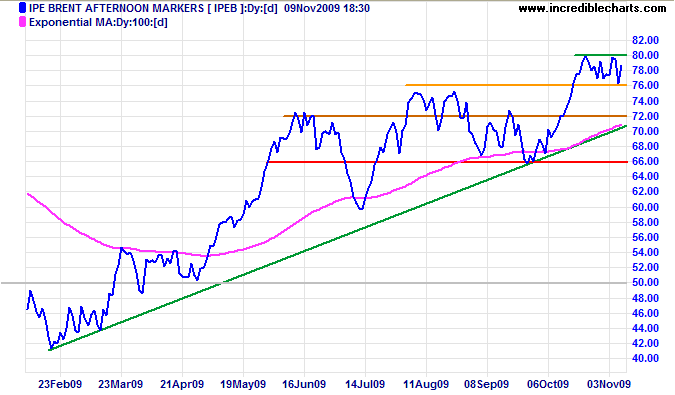
* Target calculation: 80 + ( 80 - 76 ) = 84
Help to keep this newsletter free! Forward this link to friends and colleagues
![]()
The Berlin Wall is the defining achievement of socialism.
~ George F. Will

Author: Colin Twiggs is a former investment banker with almost 40 years of experience in financial markets. He co-founded Incredible Charts and writes the popular Trading Diary and Patient Investor newsletters.
Using a top-down approach, Colin identifies key macro trends in the global economy before evaluating selected opportunities using a combination of fundamental and technical analysis.
Focusing on interest rates and financial market liquidity as primary drivers of the economic cycle, he warned of the 2008/2009 and 2020 bear markets well ahead of actual events.
He founded PVT Capital (AFSL No. 546090) in May 2023, which offers investment strategy and advice to wholesale clients.
