Consolidation Or Correction?
By Colin Twiggs
November 6, 2009 10:30 p.m. ET (2:30 p.m. AET)
These extracts from my trading diary are for educational purposes and should not be interpreted as investment or trading advice. Full terms and conditions can be found at Terms of Use.
The Dow rallied above the key 10000 level; the current pattern closer resembles a consolidation rather than a correction. News that US unemployment reached 10.2 percent failed to dampen enthusiasm. Buying pressure driven by monetary expansion rather than sound fundamentals is fueling a new bubble.
USA
Dow Jones Industrial Average
The Dow is consolidating in a narrow band after recovering above 10000. Bearish divergence on Twiggs Money Flow (13-week) continues to warn of a secondary correction, but the shorter-term (21-day) indicator respected the zero line, indicating a resurgence of buyers. Breakout above 10100 would indicate that the correction has ended before it really started, signaling an advance to 10500*; while reversal below 9900 would warn of a correction. In the long term, a primary advance would offer a target of 12000*.
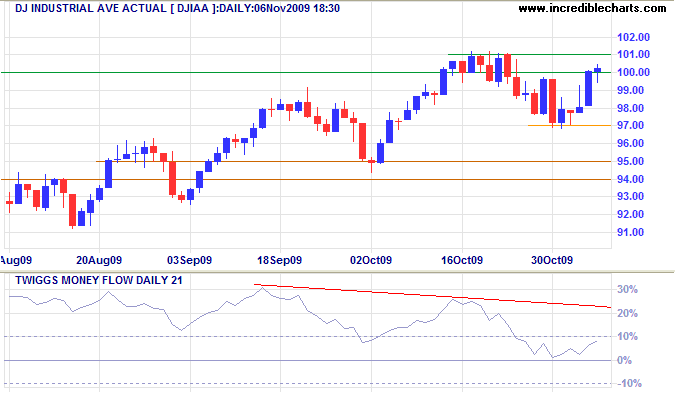
* Target calculations: 10100 + ( 10100 - 9700 ) = 10500 and 10000 + ( 10000 - 8000 ) = 12000
S&P 500
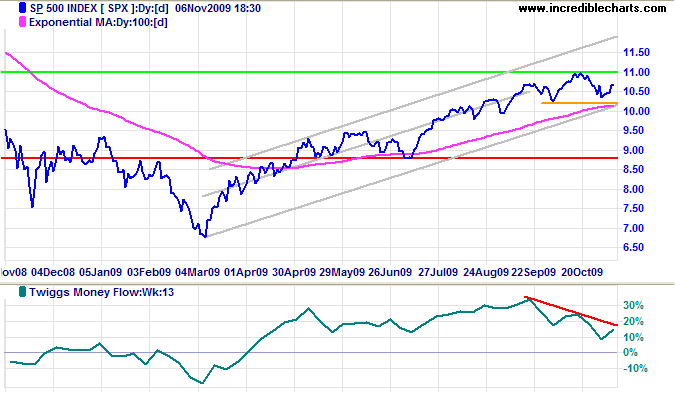
The S&P 500 shows a similar bearish divergence on Twiggs Money Flow (13-week). Reversal below support at 1020 would indicate a secondary correction, while breakout above 1100 would signal an advance to the upper trend channel.
Transport
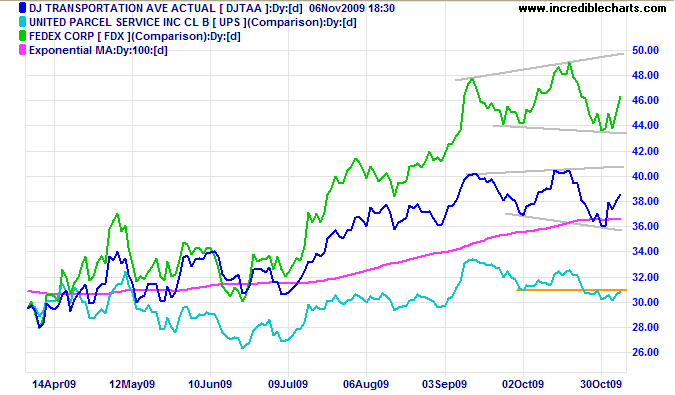
The Dow Transport Average and Fedex display broadening wedge consolidations, a weak continuation pattern. UPS, however, reversed to a primary down-trend — a bearish sign for the economy.
Technology
The Nasdaq 100 also shows another broadening wedge consolidation (right-angled ascending). Bearish divergence on Twiggs Money Flow (21-day) warns of a secondary correction, but respect of the zero line indicates a (short-term) resurgence of buyers. Failure of support at 1650 would confirm the correction, while breakout above 1780 would indicate a primary advance to 1900*.
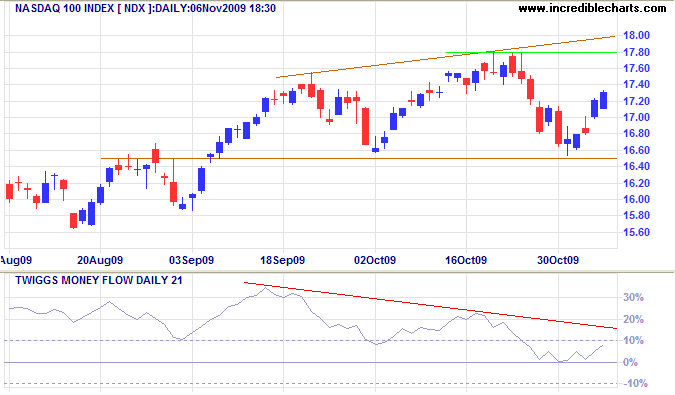
* Target calculation: 1780 + ( 1780 - 1660 ) = 1900
Canada: TSX
The TSX Composite shows a (right-angled descending) broadening wedge, another weak continuation pattern. Bearish divergence on Twiggs Money Flow (21-day) warns of a secondary correction, but respect of the zero line indicates a (short-term) resurgence of buyers. Reversal below 10800 would confirm the correction, while recovery above 11600 would signal an advance to 12400*.
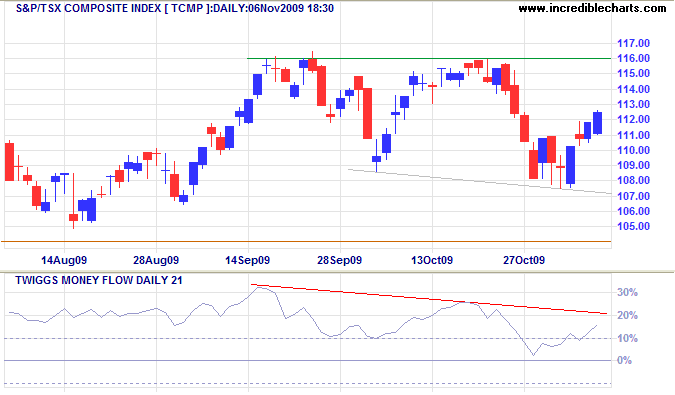
* Target calculation: 11600 + ( 11600 - 10800 ) = 12400
United Kingdom: FTSE
The FTSE 100 formed a (right-angled ascending) broadening wedge. Breakout above 5300 would signal an advance to 5600*, while reversal below 5000 would signal a secondary correction. Twiggs Money Flow (21-day) recovered above zero, indicating a short-term resurgence of buyers, but the longer-term (13-week) indicator continues to warn of a correction.
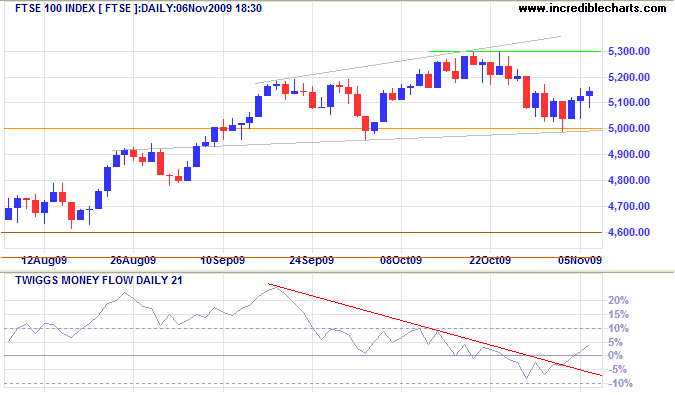
* Target calculation: 5300 + ( 5300 - 5000 ) = 5600
Germany: DAX
The DAX also displays a broadening wedge consolidation, a weak continuation pattern. Reversal below 5300 would signal a secondary correction. Bearish divergences on Twiggs Money Flow (13-week & 21-day) warn of selling pressure. Breakout would offer a target of 4700*.
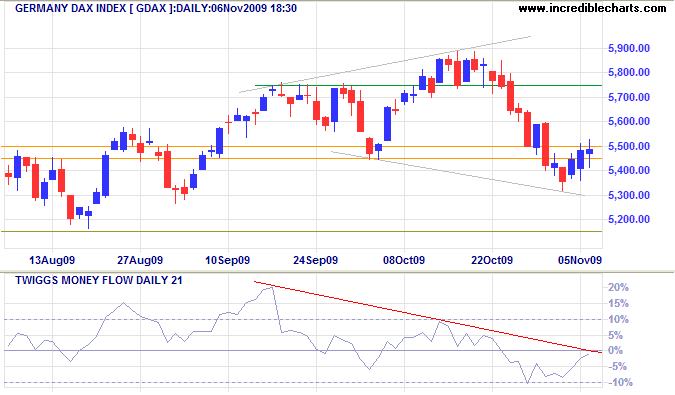
* Target calculation: 5300 -( 5900 - 5300 ) = 4700
Help to keep this newsletter free! Forward this link to friends and colleagues
![]()
The greed merchants needed a co-conspirator, and that co-conspirator is and was the United States government.
They're always there waiting to hand out free money. They just throw money at the problem every time Wall Street gets in trouble.
~ Legendary investor Ted Forstmann
as quoted by Charles Gasparino

Author: Colin Twiggs is a former investment banker with almost 40 years of experience in financial markets. He co-founded Incredible Charts and writes the popular Trading Diary and Patient Investor newsletters.
Using a top-down approach, Colin identifies key macro trends in the global economy before evaluating selected opportunities using a combination of fundamental and technical analysis.
Focusing on interest rates and financial market liquidity as primary drivers of the economic cycle, he warned of the 2008/2009 and 2020 bear markets well ahead of actual events.
He founded PVT Capital (AFSL No. 546090) in May 2023, which offers investment strategy and advice to wholesale clients.
