Gold & Oil Rise As Dollar Falls
By Colin Twiggs
October 20, 2009 1:00 a.m. ET (4:00 p.m. AET)
These extracts from my trading diary are for educational purposes and should not be interpreted as investment or trading advice. Full terms and conditions can be found at Terms of Use.
US Dollar Index
The US Dollar Index is consolidating in a narrow band below resistance at 76. In the short term, expect a test of 74.50*. Reversal above 77.50 is most unlikely, but would indicate that the down-trend has ended. The greenback is replacing the yen as the favorite weak currency used for carry trades. Hedge funds effectively borrow dollars then sell them to invest in a high-yielding currency like the Australian Dollar, pocketing the interest rate spread — and reinforcing the dollar's downward spiral.
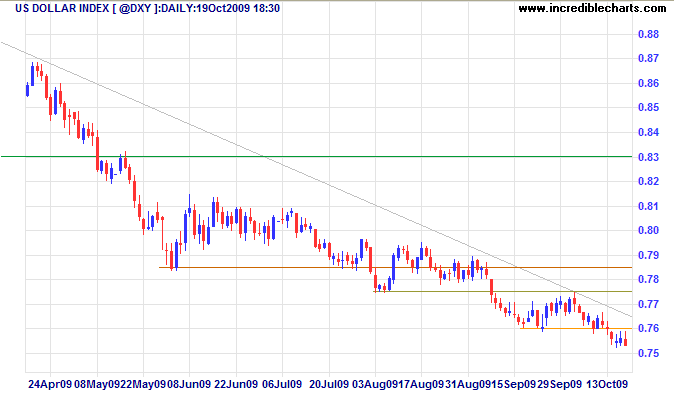
* Target calculation: 76.00 - ( 77.50 - 76.00 ) = 74.50
Crude Oil
Crude oil broke through resistance at $75 to signal a primary advance with a target of $85*, on the back of a weakening dollar. Reversal below $75 is unlikely, but would form a rising wedge reversal pattern; breakout below the rising trendline would strengthen the signal.
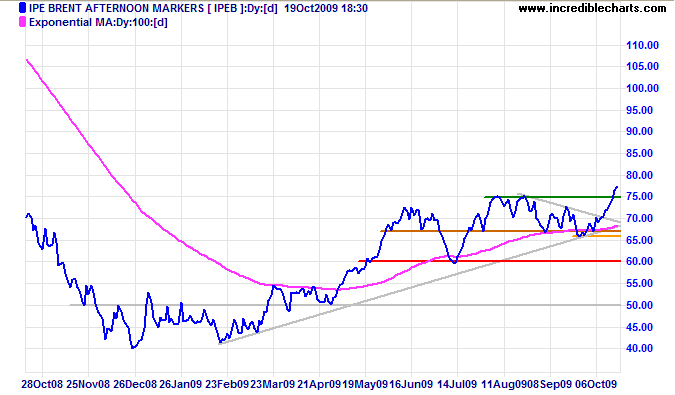
* Target calculation: 75 + ( 75 - 65 ) = 85
Gold
Spot gold shows signs of an accelerating up-trend, after three trendlines of increasing slope. Retracement respected support at $1040 and breakout above $1070 would indicate an advance to $1100*. Reversal below $1040 is unlikely, but would test $1000. In the long term, the break above $1000 offers a target of $1300*; failure of support at $985 is unlikely, but would warn of a primary trend reversal.
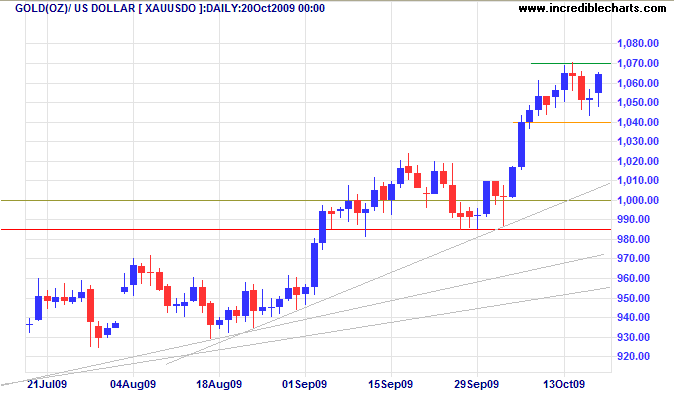
* Target calculations: 1000 + ( 1000 - 900 ) = 1100 and 1000 + ( 1000 - 700 ) = 1300
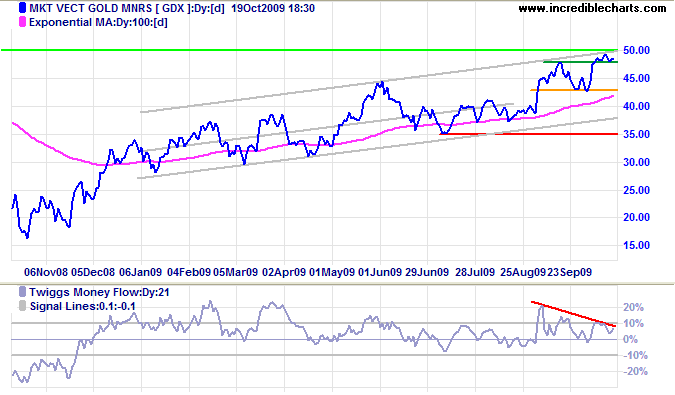
The only bearish sign is a divergence on Twiggs Money Flow (21-day), warning that the Market Vectors Gold Miners Index [GDX] has encountered selling pressure. Breakout above $50 would confirm the rise in spot gold, while reversal below $43 would signal a secondary correction (and bearish sign for gold). Divergences between gold miners and physical gold often forewarn of changes in the spot price.
Silver
Spot silver continues to advance, the latest retracement respecting support at $17. Breakout above $18 would offer a target of $19*. Reversal below the rising trendline at $17 is unlikely, but would warn of a secondary correction.
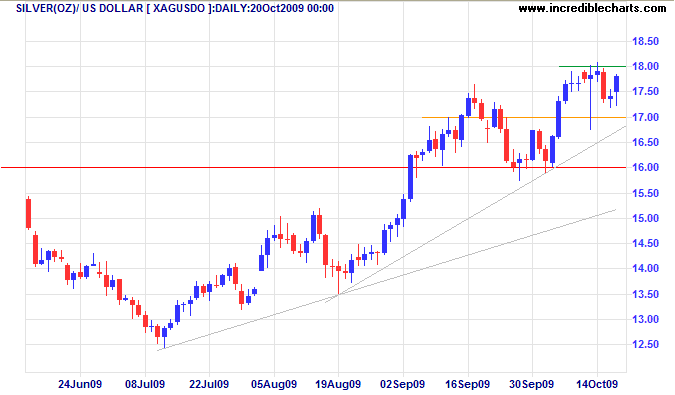
* Target calculation: 18 + ( 18 - 17 ) = 19
Platinum
Platinum continues its primary advance, testing resistance at $1350. Breakout above $1360 would test the medium-term target at 1450*. Reversal below the rising trendline at $1300 is unlikely, but would warn of a secondary correction. In the long term, expect a primary advance to $1500*; failure of support at $1100 is most unlikely, but would signal a primary down-trend.
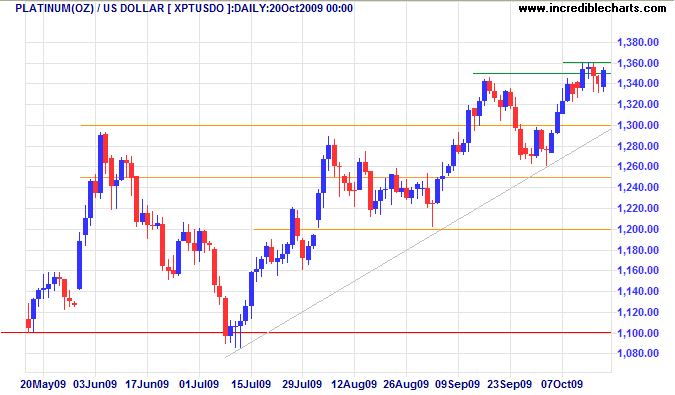
* Target calculations: 1350 + ( 1350 - 1250 ) = 1450 and 1300 + ( 1300 - 1100 ) = 1500
Help to keep this newsletter free! Forward this link to friends and colleagues
![]()
The root of most financial errors is "when you try to do today what you wished you had done yesterday."
~ Lawrence H. Summers

Author: Colin Twiggs is a former investment banker with almost 40 years of experience in financial markets. He co-founded Incredible Charts and writes the popular Trading Diary and Patient Investor newsletters.
Using a top-down approach, Colin identifies key macro trends in the global economy before evaluating selected opportunities using a combination of fundamental and technical analysis.
Focusing on interest rates and financial market liquidity as primary drivers of the economic cycle, he warned of the 2008/2009 and 2020 bear markets well ahead of actual events.
He founded PVT Capital (AFSL No. 546090) in May 2023, which offers investment strategy and advice to wholesale clients.
