The Ides Of September
By Colin Twiggs
September 14, 5:30 a.m. ET (7:30 p.m. AET)
These extracts from my trading diary are for educational purposes and should not be interpreted as investment or trading advice. Full terms and conditions can be found at Terms of Use.
We are approaching the end of the third quarter and risk of a secondary correction is heightened from mid-September to mid-October. For those who managed to avoid prolonged exposure to William Shakespeare, Ides is the 13th day of September on the Roman calendar.
Commodities
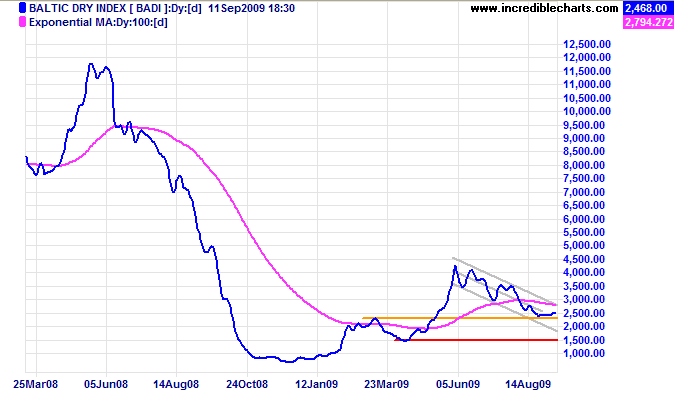
The Baltic Dry Index continues a strong correction as a result of falling demand for bulk commodities. Failure of support at 2400 would indicate another test of the lower channel border — and no relief for resources stocks.
The RJ/CRB Commodities Index further underlines weak demand for commodities: respect of the declining trendline signaling a down-swing to 240*. Reversal above the declining trendline is unlikely at present, but would warn that the secondary correction is weakening.
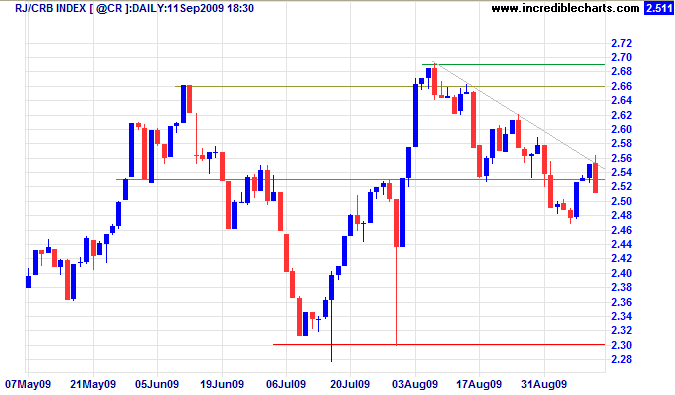
* Target calculation: 248 - ( 256 - 248 ) = 240
USA
Dow Jones Industrial Average
The Dow is testing resistance at 9600, Friday's doji signaling indecision. Breakout would signal an advance to 10000*, while reversal below 9250 would warn of a secondary correction. Bearish divergence on Twiggs Money Flow (21-day) warns of short-term selling pressure, increasing risk of a reversal.
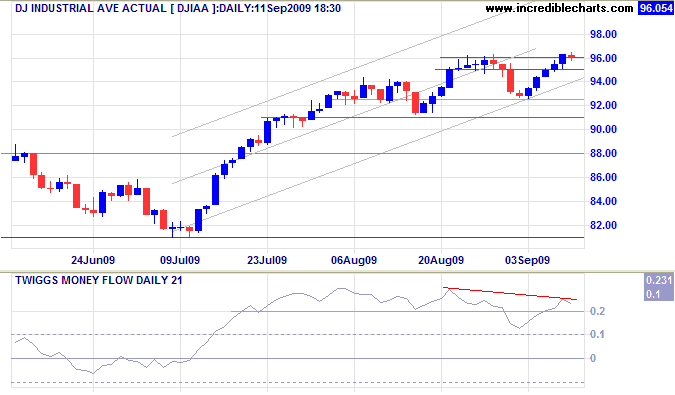
* Target calculation: 9600 + ( 9600 - 9200 ) = 10000
S&P 500
The S&P 500 broke through resistance at 1030, signaling an advance to 1100*, but Twiggs Money Flow (21-day) echoes the Dow's bearish divergence. Rising Twiggs Money Flow (13-week), however, indicates long-term buying pressure — a conflicting signal. Reversal below 990 would warn of a secondary correction.
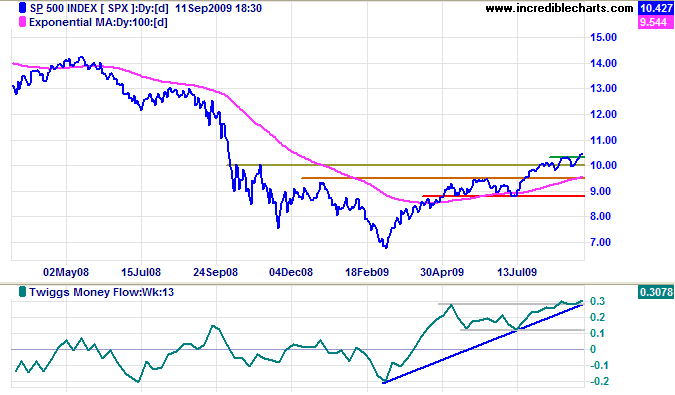
* Target calculation: 1000 + ( 1000 - 900 ) = 1100
Transport
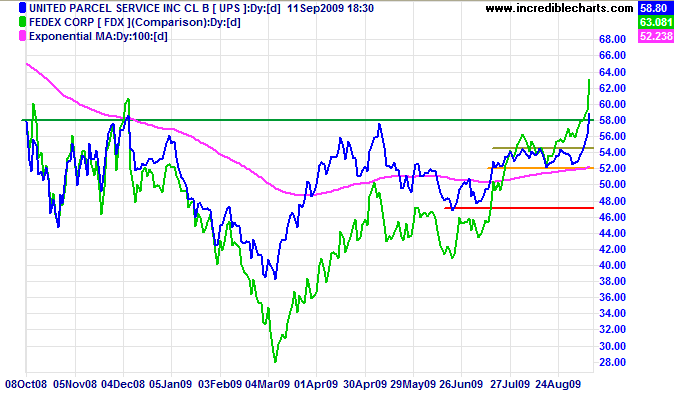
UPS broke through resistance at 5500 to join the Dow Transport Average and Fedex in a primary up-trend. The signal was subsequently confirmed by breakout above long-term resistance at 5800. The Transport sector conveys a positive outlook for the economy.
Technology
The failed/partial swing on the Nasdaq 100 broadening top is a bullish continuation pattern. Breakout above 1700 would confirm an advance to 1800*. Twiggs Money Flow (21-day) reversal above its declining trendline strengthens the signal.
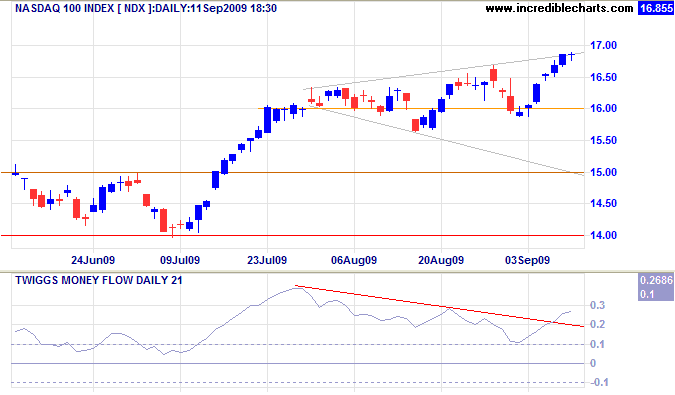
* Target calculation: 1600 + ( 1600 - 1400 ) = 1800
Canada: TSX
The TSX Composite respected the new support level at 11000, confirming a primary advance with a target of 12000*. Rising Twiggs Money Flow (21-day) indicates buying pressure. Failure of support at 10500/10600 is most unlikely, but would warn of a secondary correction.
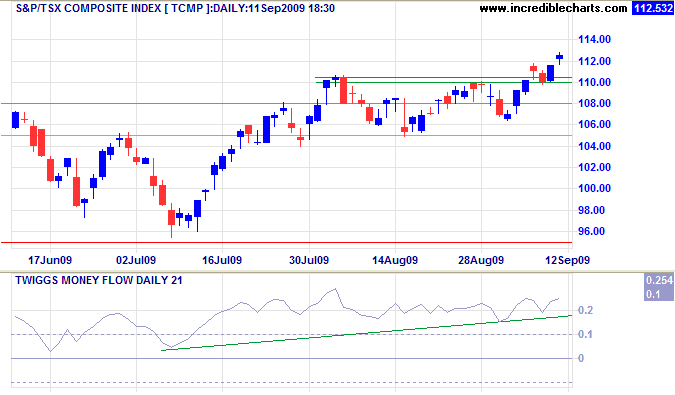
* Target calculation: 10800 + ( 10800 - 9600 ) = 12000
United Kingdom: FTSE
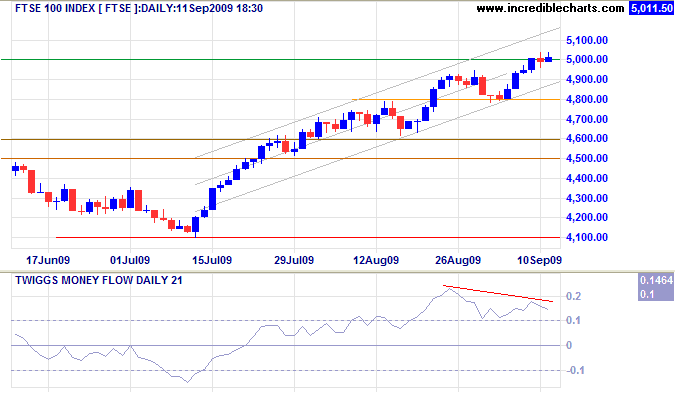
The FTSE 100 is testing the key resistance level at 5000, but bearish divergence on Twiggs Money Flow (21-day) warns of selling pressure. Reversal below 4800 would signal a secondary correction.
Europe: DAX
The DAX broke through resistance at 5550, signaling a test of the upper trend channel around 5700. Twiggs Money Flow (21-day) threatens a bearish divergence; breakout below its rising trendline would warn of selling pressure. Reversal below 5250 would signal a secondary correction.
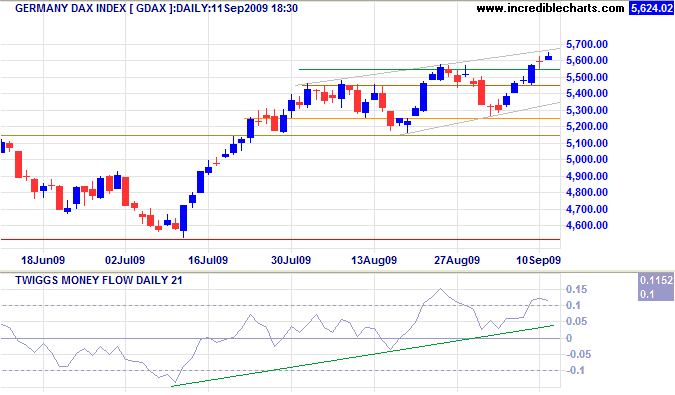
* Target calculation: 5200 + ( 5200 - 4500 ) = 5900
India: Sensex
The Sensex broke through resistance at 16000, signaling a primary advance with a target of 17500*. The index is now retracing to test the new support level; respect would confirm the primary advance. Reversal below 15500 is unlikely, but would warn of a secondary correction — confirmed if support at 14800 is broken. Twiggs Money Flow (21-Day) holding well above the zero line indicates buying pressure; decline below 0.05, however, would warn that sellers are starting to dominate.
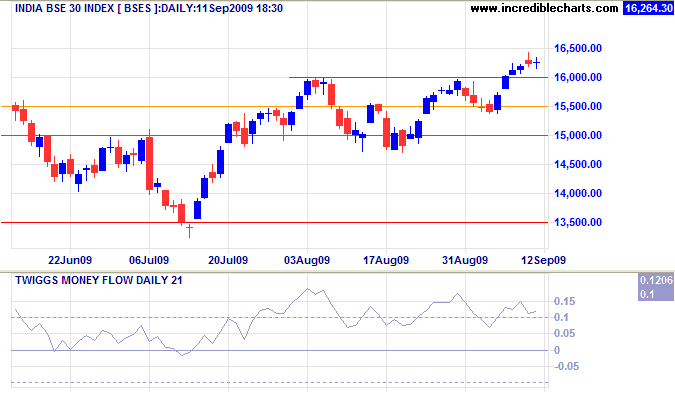
* Target calculation: 15500 + ( 15500 - 13500 ) = 17500
Japan: Nikkei
The Nikkei 225 continues to consolidate between 10200 and 10600, with the index again retreating to test the support level by 11:00 a.m. on Monday. Breakout would warn of a secondary correction — confirmed if support at 10000 is broken. Twiggs Money Flow (21-day) reversal below zero would strengthen the signal. Recovery above 10600 is unlikely at present, but would indicate a primary advance with a target of 11000*.
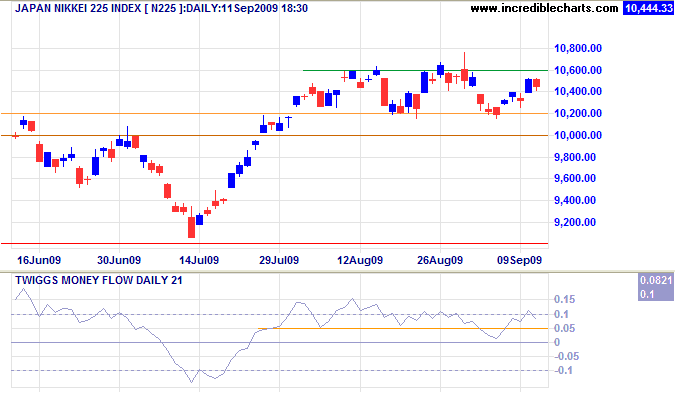
* Target calculation: 10000 + ( 10000 - 9000 ) = 11000
South Korea
The Seoul Composite Index broke through resistance at 1620, signaling a primary advance to 1700*. Rising Twiggs Money Flow (21-day) indicates buying pressure. Monday morning's retracement to 1630 at this stage appears no more than a test to confirm the new support level. Reversal below 1590, however, would warn of a secondary correction — confirmed if support at 1530 is broken.
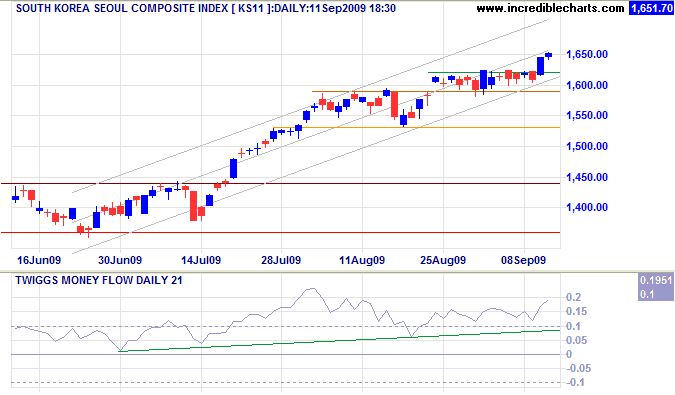
* Target calculation: 1450 + ( 1450 - 1200 ) = 1700
China
The Shanghai Composite Index broke through resistance at 3000 early Monday afternoon, indicating another test of the peak at 3500. Expect a retracement to test the new support level, however, and Twiggs Money Flow (21-day) reversal below the short-term rising trendline would warn that selling pressure has resumed. Reversal below 2800 remains less likely, but would warn of another down-swing with a target of 2300* — confirmed if support at 2650 is broken.
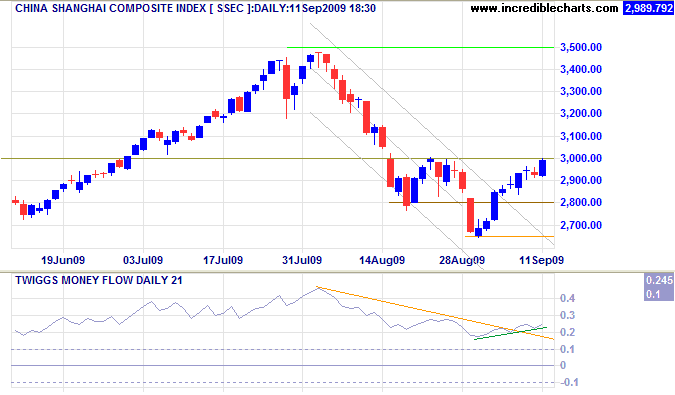
* Target calculations: 2800 - ( 3300 - 2800 ) = 2300
After breaking through resistance at 21000, the Hang Seng Index signaled hesitancy with two doji candles just above the new support level. Today the index opened back below the support level, warning of further weakness. Retreat below 20500 would confirm another test of primary support at 19500; failure would signal a primary down-trend. Twiggs Money Flow (21-day) reversal below zero would strengthen the signal. Recovery above 21000, however, would signal a primary advance with a target of 22500*.
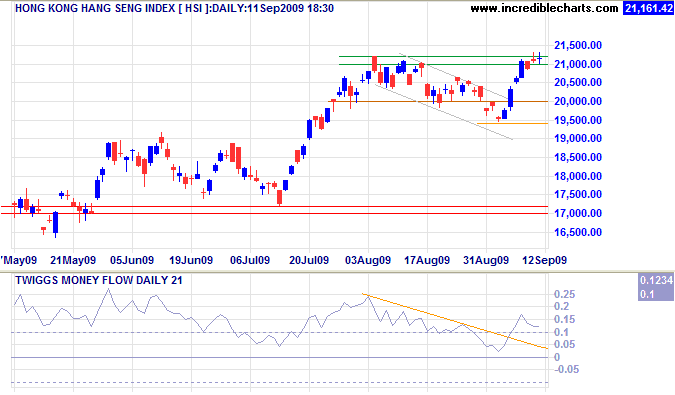
* Target calculation: 21000 + ( 21000 - 19500 ) = 22500
Australia: ASX
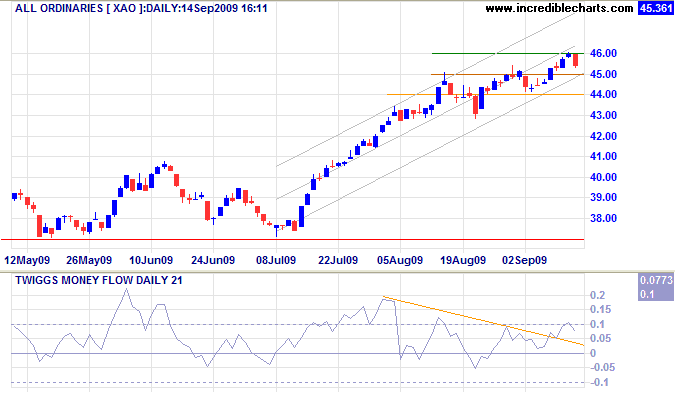
Resources stocks face selling pressure from falling commodity prices. The All Ordinaries advanced to 4600 before retreating sharply. Failure of support at 4500 would warn of a secondary correction, while penetration of 4400 would confirm. Twiggs Money Flow (21-day) reversal below zero would strengthen the bear signal, while recovery above 0.1 would indicate another rally.
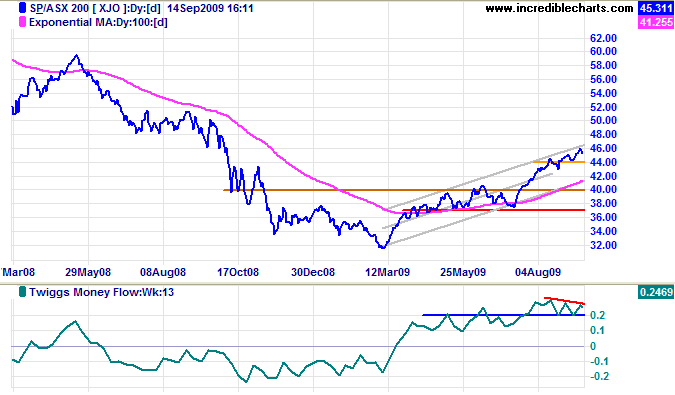
The ASX 200 is testing the upper trend channel at 4600. Reversal below 4400 would signal a correction to test the lower channel. Twiggs Money Flow (13-week) small bearish divergence indicates short-term selling pressure, but long-term the picture remains strong.
Reminder: This is no blue sky rally. Enjoy it while it lasts. But bear in mind that it could end badly. And keep your stops tight.
Help to keep this newsletter free! Forward this link to friends and colleagues
![]()
If the American people ever allow private banks to control the issue of their currency, first by inflation, then by deflation,
the banks will deprive the people of all property until their children wake-up homeless on the continent their fathers conquered.
The issuing power should be taken from the banks and restored to the people, to whom it properly belongs.
~ Thomas Jefferson (1743 - 1826)

Author: Colin Twiggs is a former investment banker with almost 40 years of experience in financial markets. He co-founded Incredible Charts and writes the popular Trading Diary and Patient Investor newsletters.
Using a top-down approach, Colin identifies key macro trends in the global economy before evaluating selected opportunities using a combination of fundamental and technical analysis.
Focusing on interest rates and financial market liquidity as primary drivers of the economic cycle, he warned of the 2008/2009 and 2020 bear markets well ahead of actual events.
He founded PVT Capital (AFSL No. 546090) in May 2023, which offers investment strategy and advice to wholesale clients.
