Gold & Platinum Triangles
By Colin Twiggs
September 1, 2009 3:30 a.m. ET (5:30 p.m. AET)
These extracts from my trading diary are for educational purposes and should not be interpreted as investment or trading advice. Full terms and conditions can be found at Terms of Use.
US Dollar Index
The US Dollar Index is consolidating around the former primary support level at 78.50. Downward breakout is likely and would signal a down-swing with a target of 74* — indicating higher gold and oil prices. Recovery above 79.50 is unlikely, but would warn of reversal to a primary up-trend.
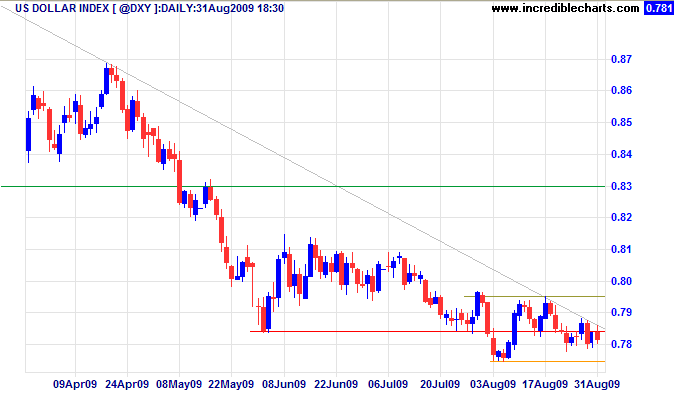
* Target calculation: 78.5 - ( 83 - 78.5 ) = 74
Gold
Spot gold is entering the apex of the triangular pattern, where breakouts are less reliable. A rise above resistance at $970, however, would test $1000; while failure of support at $925 would test primary support at $900. In the long term, breakout above $1000 would signal an advance to $1100*, while breakout below support at $900 would test the November low of $700.
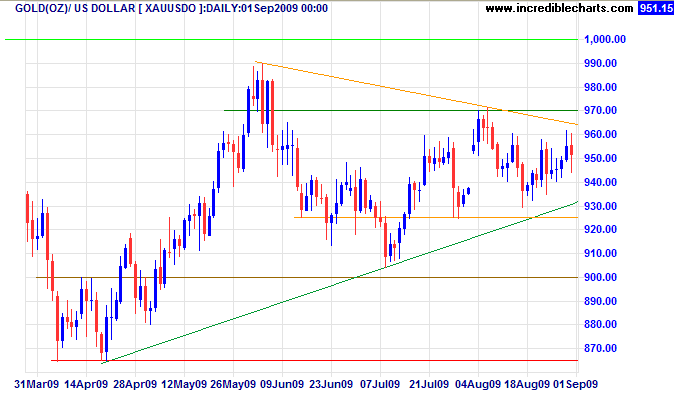
* Target calculation: 1000 + ( 1000 - 900 ) = 1100
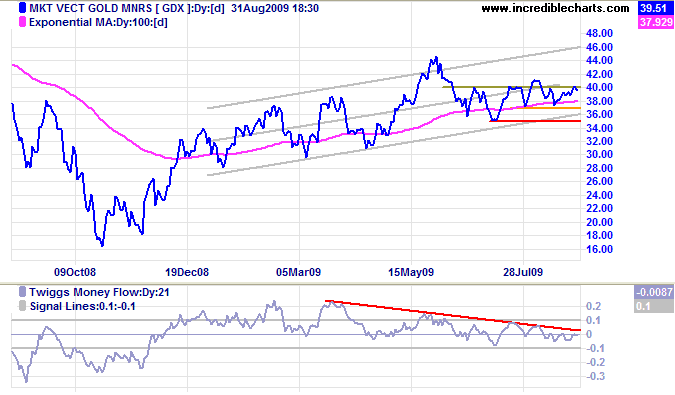
The Market Vectors Gold Miners Index [GDX] is testing resistance at $40; breakout would signal an advance to the upper trend channel — a positive sign for spot gold prices. Twiggs Money Flow (21-day) breakout above zero and the declining trendline would reinforce the signal. Until then, reversal below $37 remains as likely and would warn that the primary up-trend is weakening.
Silver
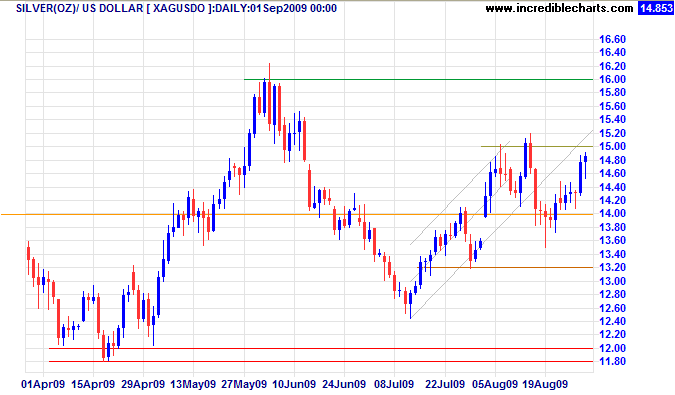
Spot silver is testing resistance at $15. Breakout would signal a test of $16, while reversal below $14 would warn of another secondary correction. In the long term, a fall below $12.50 would signal a primary trend reversal; while breakout above $16 would indicate a primary advance with a target of $19 — a positive sign for gold.
Platinum
Platinum is affected by declining commodity prices. Failure of the CRB Commodities Index short-term support level (at 253) would be a strong bear signal for platinum. The descending triangle warns of selling pressure; and breakout below 1220 would signal a test of $1100. Recovery above $1300 is unlikely, but would indicate an advance to $1500*. Reversal below $1100 remains unlikely as well, but would signal a primary trend change.
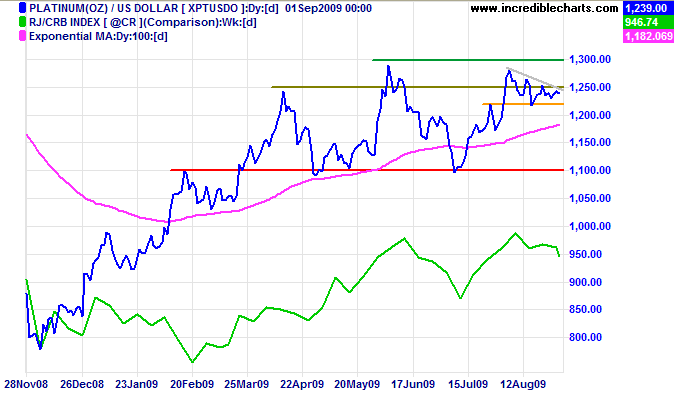
* Target calculation: 1300 + ( 1300 - 1100 ) = 1500
Crude Oil
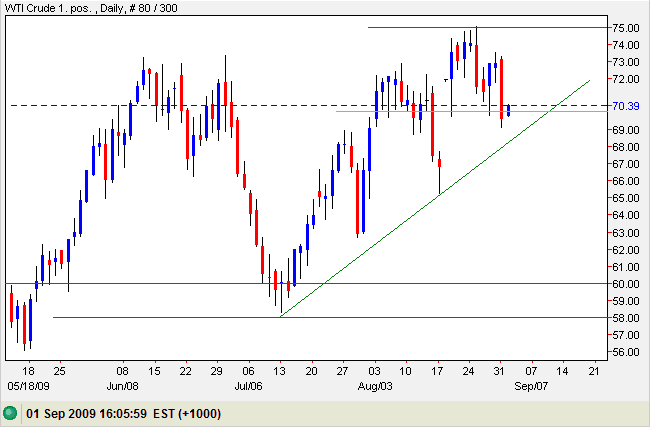
Crude oil is testing support at $70/barrel; breakout would warn of a secondary correction. Penetration of the rising trendline would strengthen the signal. Reversal above $75, however, would indicate an advance with a target of $80*.
Source: Netdania
* Target calculation: 70 + ( 70 - 60 ) = 80
Help to keep this newsletter free! Forward this link to friends and colleagues
![]()
When a person tries to act in accordance with his conscience, when he tries to speak the truth,
when he tries to behave like a citizen, even in conditions where citizenship is degraded, it won't necessarily lead anywhere, but it might.
~ Vaclav Havel

Author: Colin Twiggs is a former investment banker with almost 40 years of experience in financial markets. He co-founded Incredible Charts and writes the popular Trading Diary and Patient Investor newsletters.
Using a top-down approach, Colin identifies key macro trends in the global economy before evaluating selected opportunities using a combination of fundamental and technical analysis.
Focusing on interest rates and financial market liquidity as primary drivers of the economic cycle, he warned of the 2008/2009 and 2020 bear markets well ahead of actual events.
He founded PVT Capital (AFSL No. 546090) in May 2023, which offers investment strategy and advice to wholesale clients.
