Gold & Silver Show Strength
By Colin Twiggs
April 27, 2009 9:30 p.m. ET (11:30 a.m. AET)
These extracts from my trading diary are for educational purposes and should not be interpreted as investment or trading advice. Full terms and conditions can be found at Terms of Use.
Gold
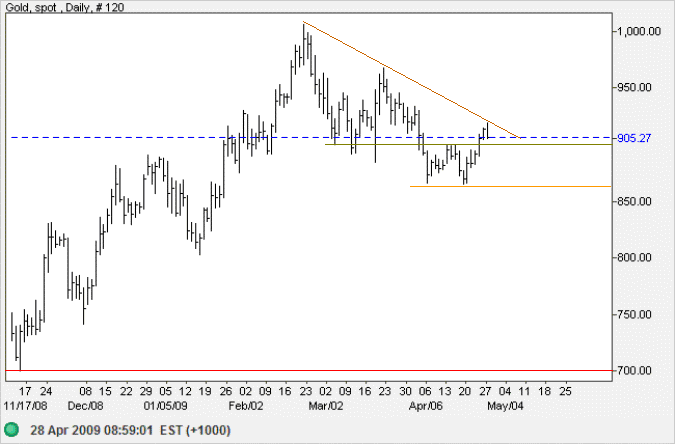
Spot gold completed a small double-bottom, breaking out above resistance at $900. Penetration of the declining trendline would warn of a trend change. Look for retracement that respects the new support level, followed by breakout above the falling trendline. Reversal below $865, however, would confirm the down-trend with a target of primary support at $700.

Source: Netdania
Silver
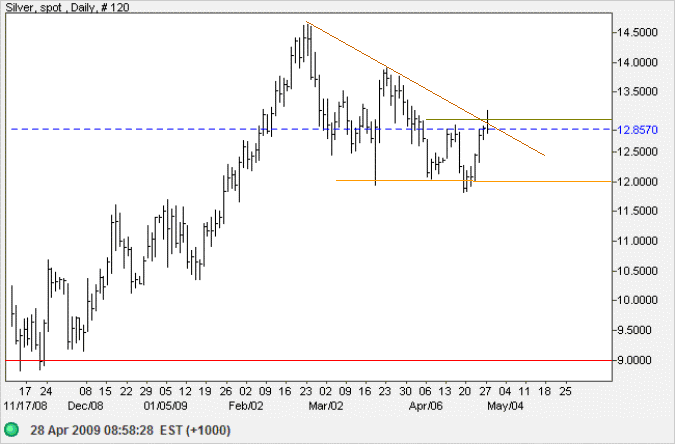
Spot silver is similarly testing the decling trendline. Clear breakout above short-term resistance at $13 would signal the start of a new up-trend — with gold likely to follow. Reversal below support at $12, however, would confirm the down-trend to test primary support at $9. Signals from silver are likely to confirm those of gold and vice versa.

Crude Oil
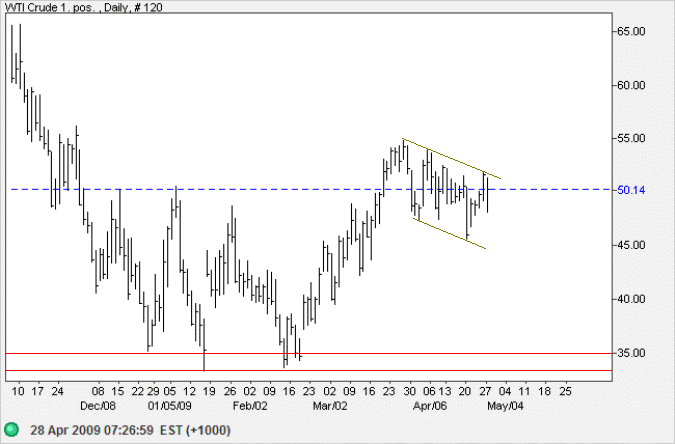
West Texas Crude formed a flag continuation pattern. Upward breakout would offer a target of $70, calculated as 50 + [55 - 35]. Downward breakout, while less likely, would test primary support at $35.

Source: Netdania
US Dollar Index
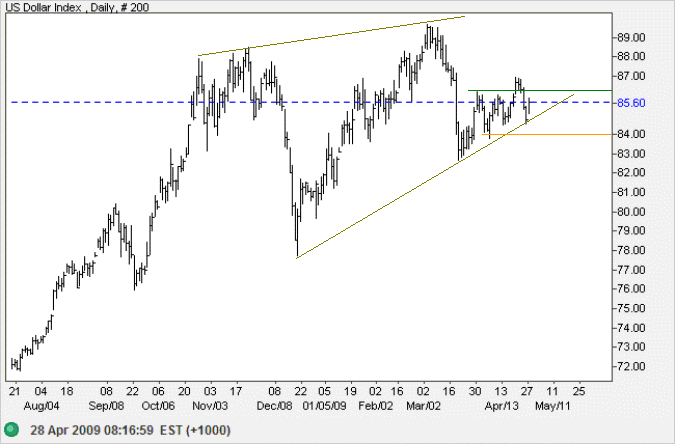
The US Dollar Index is testing the lower border of a large rising wedge pattern after a false break above 86. The formation is bearish and breakout below 84 would warn of a primary down-swing with a target of 74, calculated as 84 - [88 - 78]. Recovery above 86, on the other hand, would signal a test of the upper border. A weaker dollar would increase both crude oil and gold prices.

Democracy and socialism have nothing in common but one word: equality.
But notice the difference: while democracy seeks equality in liberty,
socialism seeks equality in restraint and servitude.
~ Alexis de Tocqueville (1848)

Author: Colin Twiggs is a former investment banker with almost 40 years of experience in financial markets. He co-founded Incredible Charts and writes the popular Trading Diary and Patient Investor newsletters.
Using a top-down approach, Colin identifies key macro trends in the global economy before evaluating selected opportunities using a combination of fundamental and technical analysis.
Focusing on interest rates and financial market liquidity as primary drivers of the economic cycle, he warned of the 2008/2009 and 2020 bear markets well ahead of actual events.
He founded PVT Capital (AFSL No. 546090) in May 2023, which offers investment strategy and advice to wholesale clients.
