When Do We Call This A Bottom?
By Colin Twiggs
April 20, 0:30 a.m. ET (2:30 p.m. AET)
These extracts from my trading diary are for educational purposes and should not be interpreted as investment or trading advice. Full terms and conditions can be found at Terms of Use.
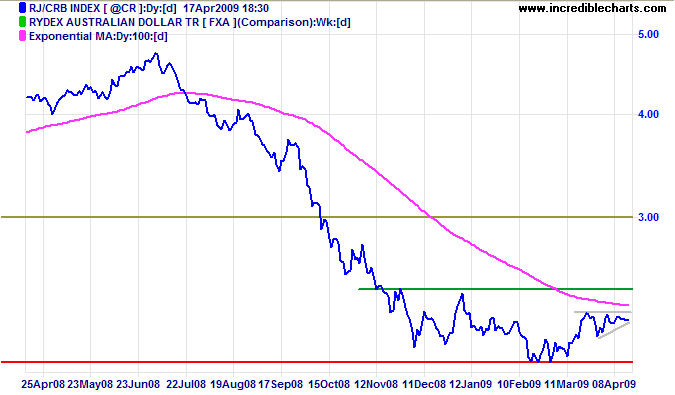
The CRB Commodities Index is establishing a base above 200, with an ascending pennant indicating a test of primary resistance at 245. Breakout above 245 (the green resistance line) would signal a primary trend reversal. Be careful of interpreting this as a sign that manufacturing levels are improving, increasing demand for commodities. The more likely explanation is stockpiling of commodities, such as copper and platinum, while prices are low. The best indicator of a turnaround would be an up-turn in sales of housing and durable goods, especially motor vehicles, after the effect of any short-term fiscal stimulus has worn off. There is no sign of this in the US or Europe. Though China reports that vehicle sales are recovering after a 2008 slow-down. (WSJ)
Financial stocks may be leading the recovery, but their balance sheets remain weak. With rising credit card defaults as unemployment increases, further mortgage write-downs if house prices continue falling, and rising commercial real estate defaults, their troubles are far from over.
USA
Dow Jones Industrial Average
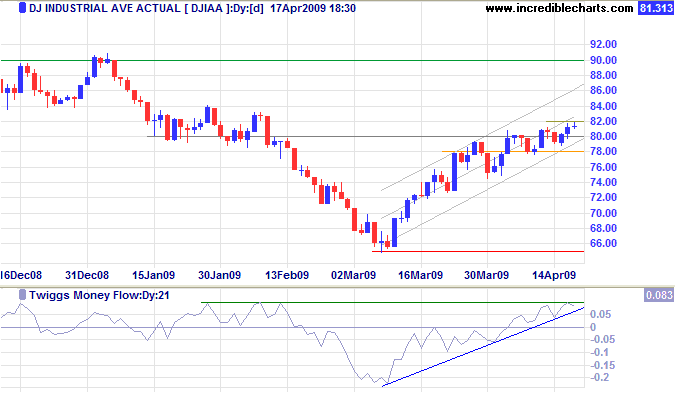
The Dow rally broke clear of resistance at 8000, but slowed over the last 3 weeks to the point where it is now testing the lower trend channel. Reversal below short-term support at 7800 would signal that the rally has ended, while follow-through above 8200 would indicate a test of 9000. Twiggs Money Flow (21-Day) oscillating between 0.1 and zero indicates consolidation; breakout above 0.1 would signal trend strength; and reversal below zero would warn of a reversal. In the long term, the primary trend is downward and respect of 9000 would indicate another down-swing.
S&P 500
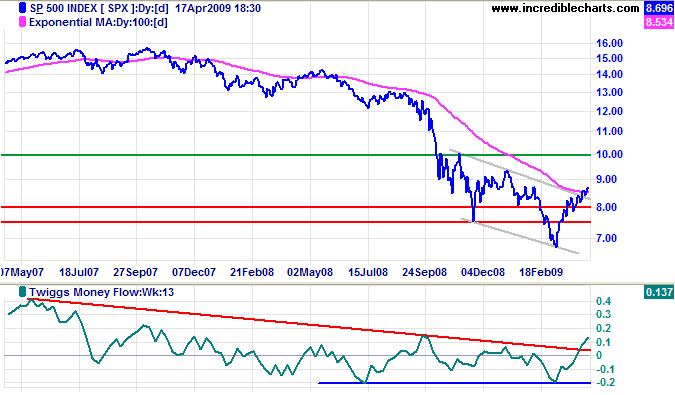
The S&P 500 continues in a gradual up-trend since breaking out of its trend channel. Expect resistance between 900 and 940, but the actual target is 1000. Twiggs Money Flow (13-Week) continues to display a weak bullish divergence. In the long term, the primary trend is down. A rise above 940 would offer a weak reversal signal, but it would be prudent to wait for a higher trough followed by a new high.
Technology
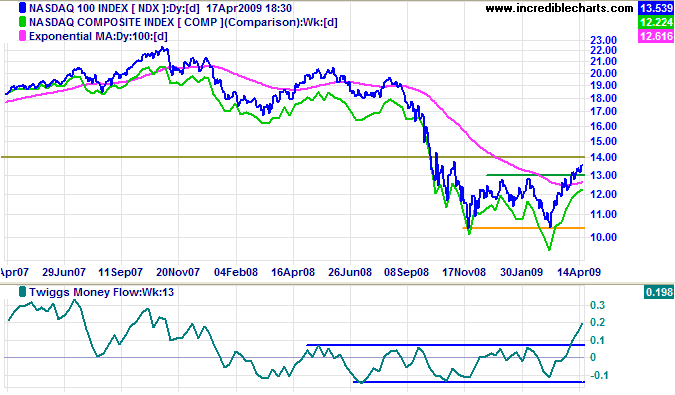
The Nasdaq Composite confirms the wide double bottom reversal on the Nasdaq 100, which has a target of 1550 (calculated as 1300 + [ 1300 - 1050]). Twiggs Money Flow (13-Week) bullish divergence adds further confirmation. The primary trend has reversed, but this is a weak signal in isolation. A bull market would require confirmation from the Dow or S&P 500.
Canada: TSX
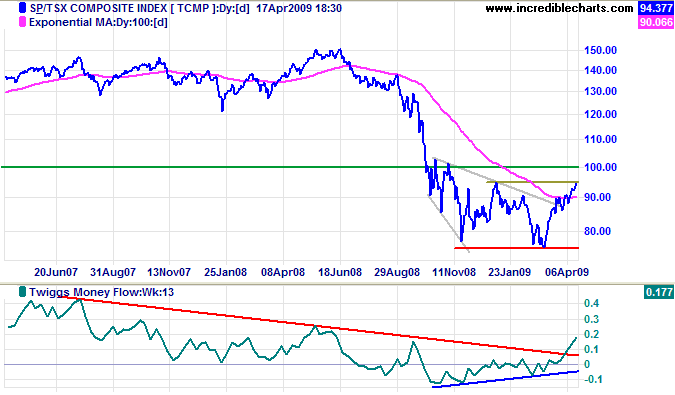
The TSX Composite is testing resistance at 9500. Breakout would complete a wide double bottom reversal with a target of 11500 (calculated as 9500 + [ 9500 - 7500 ]). Twiggs Money Flow (13-Week) bullish divergence indicates a trend reversal.
United Kingdom: FTSE
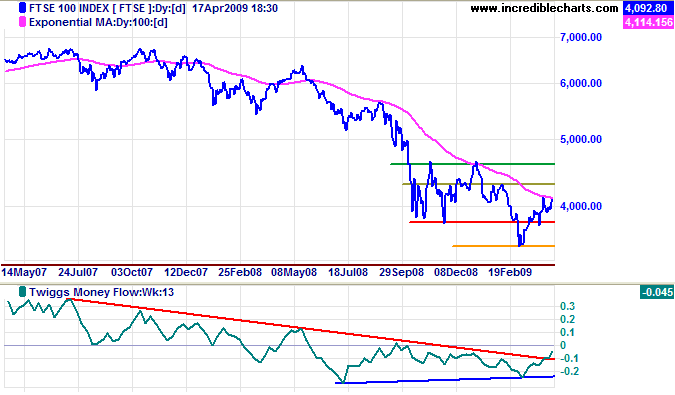
The FTSE 100 is headed for a test of resistance at 4300. Twiggs Money Flow (13-Week) rise above zero would complete a weak bullish divergence, indicating a primary trend reversal. In the long term, the primary trend is down. Reversal below 4000 would signal another test of 3500, while breakout above resistance at 4650 would offer a weak reversal signal. It would be prudent to wait for confirmation from a higher secondary trough followed by a new high.
Europe: DAX
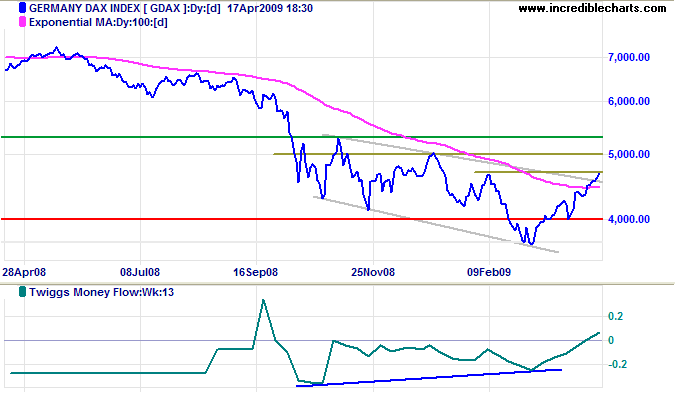
The DAX is testing resistance at 4700. Twiggs Money Flow (13-Week) rising above zero confirms buying pressure. Breakout above 5000 would offer a weak reversal signal. Again, it would be prudent to wait for confirmation from a higher secondary trough followed by a new high.
India: Sensex
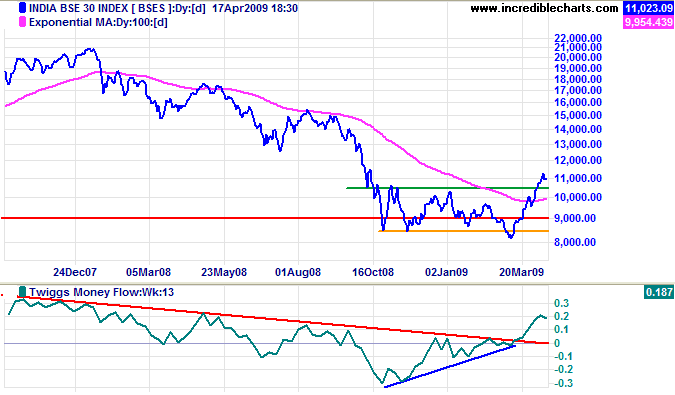
The Sensex is retracing to test the new support level at 10500. Respect would confirm the reversal to a primary up-trend. Twiggs Money Flow (13-Week) bullish divergence offers further confirmation. The target for the breakout is 12500, calculated as 10500 + [ 10500 - 8500 ].
Japan: Nikkei
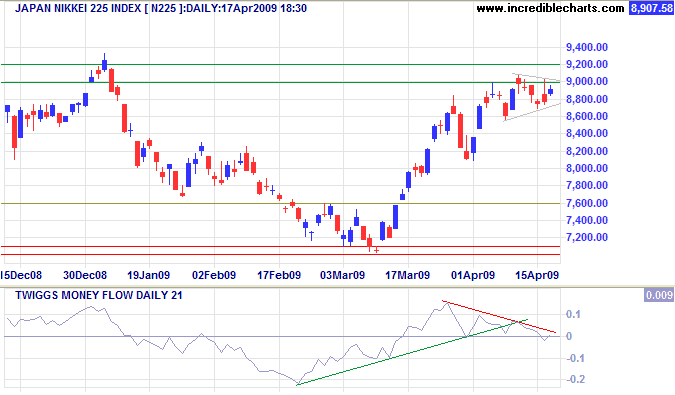
The Nikkei 225 shows a similar bullish divergence on Twiggs Money Flow (13-Week), but the shorter-term 21-day indicator warns of strong resistance at 9000. Breakout above resistance would test 9500, while reversal below 8600 would warn of another test of 7000. In the long term, breakout above 9500 would complete a wide double bottom reversal, with a target of 12000 (calculated as 9500 + [ 9500 - 7000 ]). Reversal below 7000 is unlikely, but would offer a target of 5000.
China
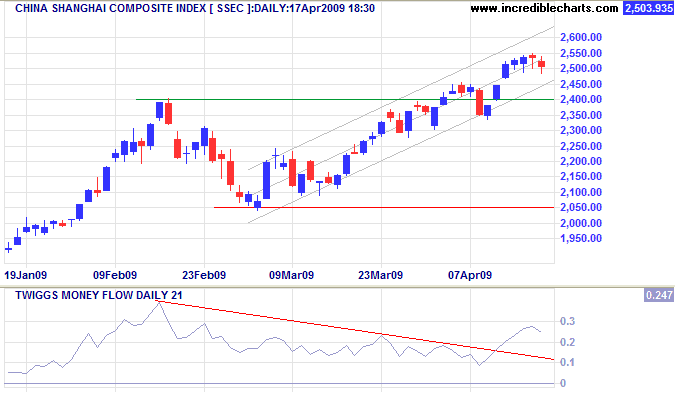
The Shanghai Composite is retracing to confirm the new support level at 2400. Respect of support would signal a strong primary up-trend. Rising Twiggs Money Flow (21-Day) adds further confirmation. The medium term target is 2750 (calculated as 2400 + [ 2400 - 2050]).
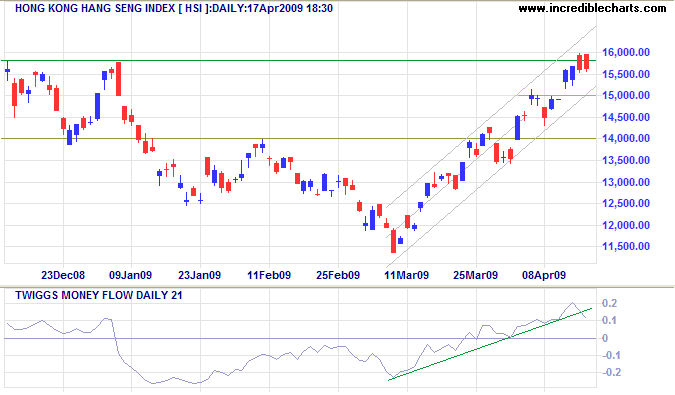
The Hang Seng Index encountered strong selling at 15800, indicated by two red candles astride the resistance line. Breakout would complete a wide double bottom reversal, offering a target of 21000 (calculated as 16000 + [ 16000 - 11000 ]). But reversal below 15000 would warn of a down-swing to test 11500. Twiggs Money Flow (13-Week) continues to display a bullish divergence, warning of a primary trend reversal.
Australia: ASX
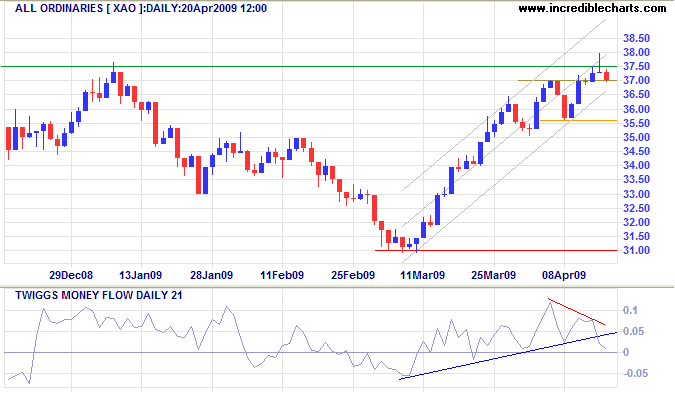
The All Ordinaries encountered strong resistance at 3750, indicated by large volume and a weak close. Twiggs Money Flow (21-Day) displays a short-term bearish divergence and a decline below zero would warn that the rally has ended. Reversal below 3560 would signal a primary decline to test 3100; and breakout below 3100 would offer a target of the 2003 low of 2300. Recovery above 3750, on the other hand, would offer a weak (primary) reversal signal, but it would be prudent to wait for a higher low (secondary trough) to confirm the trend change.
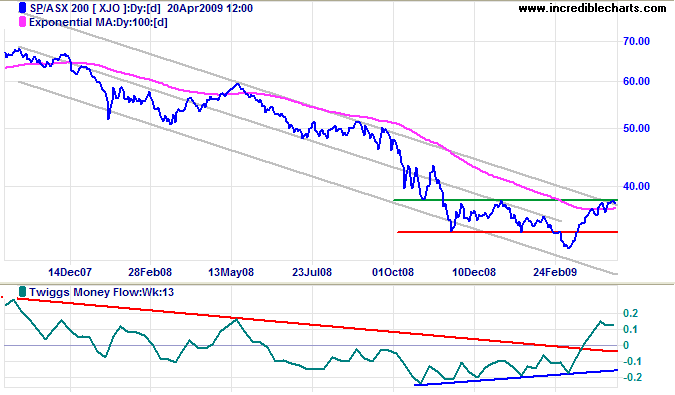
Both the ASX 200 and All Ords display bullish divergences on Twiggs Money Flow (13-Week) — indicating reversal of the primary trend. ASX 200 breakout above 3800 would offer a weak (primary) reversal signal. Again, wait for a higher trough to confirm the trend change. And for one index to confirm the other.
All wisdom starts by recognizing the facts.
~ Finnish president J.K. Paasikivi (1870 - 1956)

Author: Colin Twiggs is a former investment banker with almost 40 years of experience in financial markets. He co-founded Incredible Charts and writes the popular Trading Diary and Patient Investor newsletters.
Using a top-down approach, Colin identifies key macro trends in the global economy before evaluating selected opportunities using a combination of fundamental and technical analysis.
Focusing on interest rates and financial market liquidity as primary drivers of the economic cycle, he warned of the 2008/2009 and 2020 bear markets well ahead of actual events.
He founded PVT Capital (AFSL No. 546090) in May 2023, which offers investment strategy and advice to wholesale clients.
