Nasdaq & India Signal Up-Trend
By Colin Twiggs
April 14, 6:00 a.m. ET (8:00 p.m. AET)
These extracts from my trading diary are for educational purposes and should not be interpreted as investment or trading advice. Full terms and conditions can be found at Terms of Use.
USA
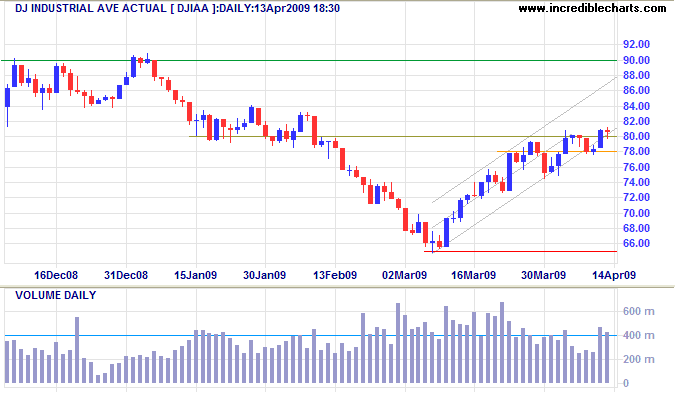
Dow Jones Industrial Average
The Dow continues to encounter resistance at 8000, indicated by the spike in volume over the last two days. Reversal below short-term support at 7800 would signal that the rally has ended, while follow-through above 8100 would indicate a test of 9000. The primary trend, however, remains downward and respect of 9000 would warn of another down-swing.
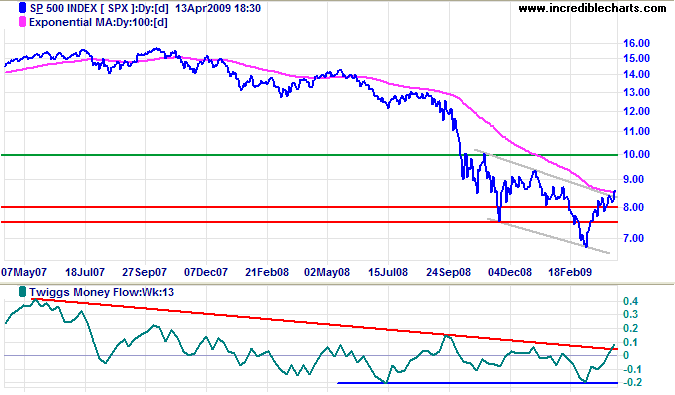
S&P 500
The S&P 500 broke out above its upper trend channel, offering a target of 10000. Twiggs Money Flow (13-Week) confirms with a weak bullish divergence. The primary trend remains down, however, and a rise above the January peak would be unconvincing. Better to wait for a higher trough followed by a new high.
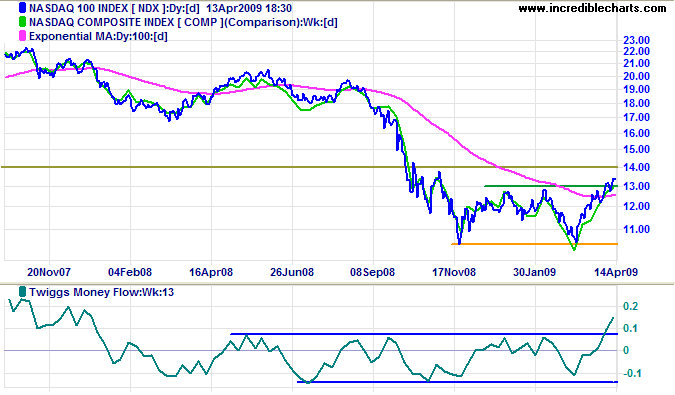
Technology
The Nasdaq Composite broke through resistance at 1650 to confirm the wide double bottom reversal on the Nasdaq 100. The Nasdaq 100 offers a target of 1550 (calculated as 1300 + [ 1300 - 1050]). The primary trend has reversed, but tech stocks do not trade in isolation and a poor earnings season for the Dow/S&P 500 would drag the Nasdaq down.
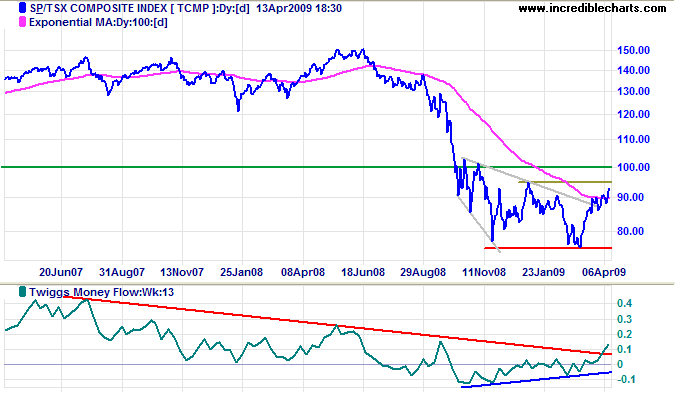
Canada: TSX
The TSX Composite breakout above a descending broadening wedge pattern offers a target of 10000 (the highest point in the pattern). Bullish divergence on Twiggs Money Flow (13-Week) provides further confirmation. In addition, a rise above 9500 would complete a wide double bottom reversal, similar to the Nasdaq, with a target of 11500 (calculated as 9500 + [ 9500 - 7500 ]).
United Kingdom: FTSE
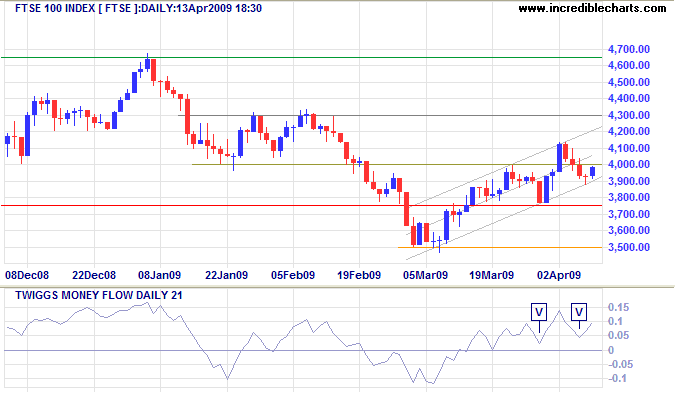
The FTSE 100 found support near the lower trend channel. Reversal above 4000 would signal another swing to the upper channel — and test of resistance at 4300. Twiggs Money Flow (21-Day) troughs above the zero line [V] signal trend strength. In the long term, the primary trend remains down and breakout below the trend channel would signal another test of 3500. Penetration of resistance at 4650 would increase the likelihood of a primary trend reversal, but confirmation would only come from a higher secondary trough followed by a new high.
Europe: DAX
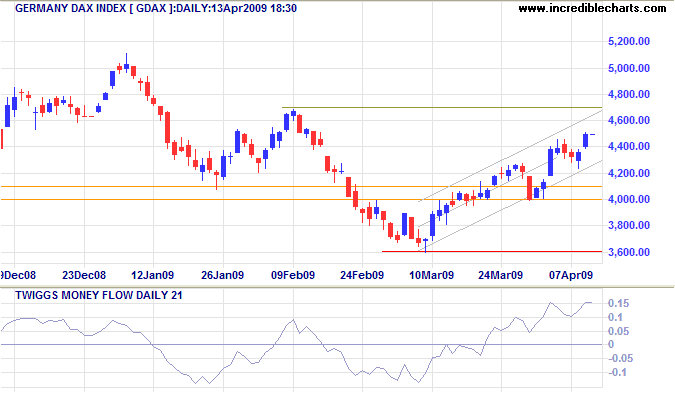
The DAX is headed for a test of resistance at 4700. Twiggs Money Flow (21-Day) rising sharply confirms buying pressure. Breakout would offer a target of 5300. The primary trend remains down, however, until there is a higher secondary trough followed by a new high.
India: Sensex
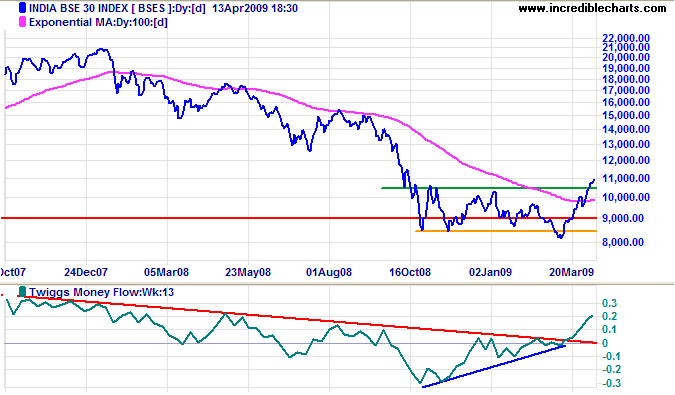
The Sensex broke through resistance at 10500, signaling reversal to a primary up-trend. Twiggs Money Flow (13-Week) confirms with a strong bullish divergence. The target is 12500, calculated as 10500 + [ 10500 - 8500 ]. First, expect retracement to test the new support level.
Japan: Nikkei
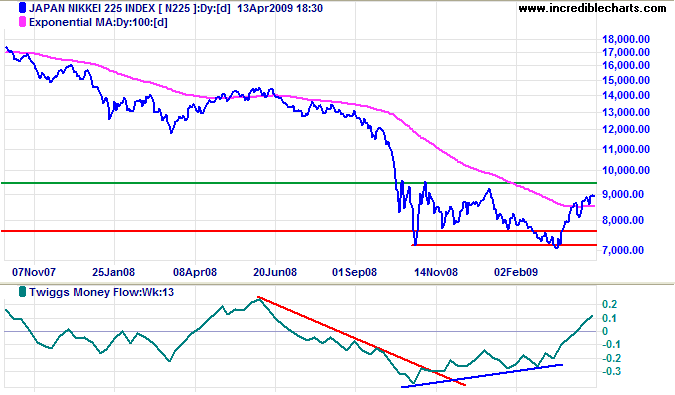
The Nikkei 225 shows a similar bullish divergence on Twiggs Money Flow (13-Week). Breakout above resistance at 9500 would confirm a wide double bottom reversal and offer a target of 12000 (calculated as 9500 + [ 9500 - 7000 ]). Respect of resistance is less likely, but would warn of another test of 7000.
China
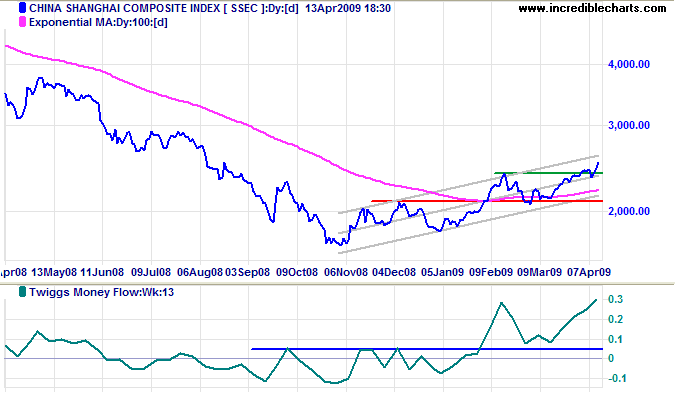
The Shanghai Composite broke through its February high of 2400, confirming a healthy primary up-trend. The medium term target is 2750 (calculated as 2400 + [ 2400 - 2050]).
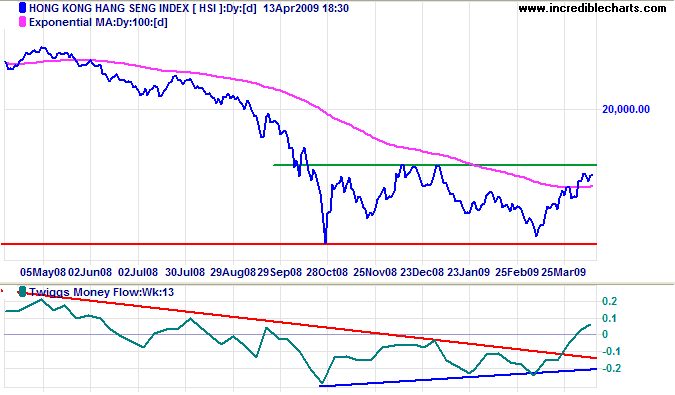
The Hang Seng Index is testing the December/January highs at 15800. Breakout would complete a wide double bottom reversal, offering a target of 21000 (calculated as 16000 + [ 16000 - 11000 ]). Twiggs Money Flow (13-Week) bullish divergence warns of a primary trend reversal.
Australia: ASX
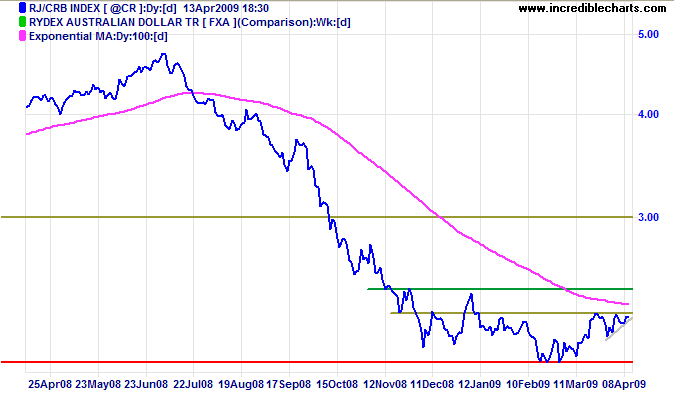
The CRB Commodities Index is testing short-term resistance at 230. Breakout is likely, given the ascending pennant formation, and would test primary resistance at 245.
The All Ordinaries up-trend is slowing below resistance at 3750. Twiggs Money Flow (21-Day) continues to signal buying pressure, however, increasing the chance of a breakout. Be wary of acting on a breakout as a (primary) trend reversal — we may have a new high, but there is no higher low (secondary trough) to confirm the trend change.
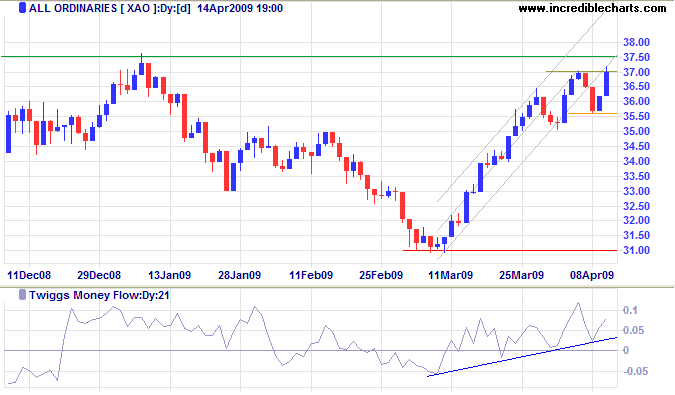
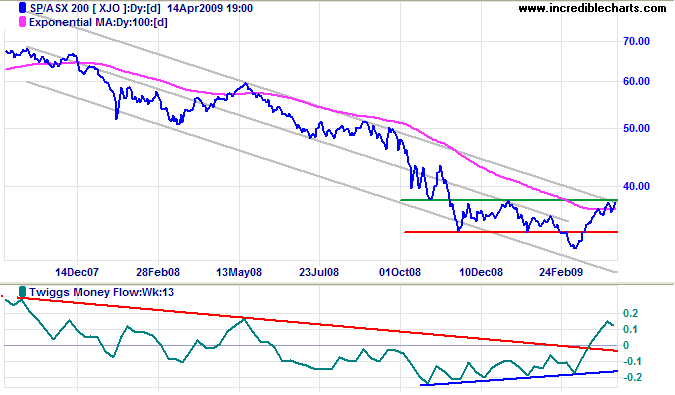
Both the ASX 200 and All Ords, however, display bullish divergences on Twiggs Money Flow (13-Week) — warning of reversal of the primary trend. Breakout above 3800 would signal that the primary down-trend has weakened. Again, wait for a higher trough to confirm the trend change.
In reading the lives of great men,
I found that the first victory they won was over themselves... self-discipline with all of them came first.
~ Harry S. Truman

Author: Colin Twiggs is a former investment banker with almost 40 years of experience in financial markets. He co-founded Incredible Charts and writes the popular Trading Diary and Patient Investor newsletters.
Using a top-down approach, Colin identifies key macro trends in the global economy before evaluating selected opportunities using a combination of fundamental and technical analysis.
Focusing on interest rates and financial market liquidity as primary drivers of the economic cycle, he warned of the 2008/2009 and 2020 bear markets well ahead of actual events.
He founded PVT Capital (AFSL No. 546090) in May 2023, which offers investment strategy and advice to wholesale clients.
