A Ray Of Sunshine
By Colin Twiggs
March 30, 4:30 a.m. ET (7:30 p.m. AET)
These extracts from my trading diary are for educational purposes and should not be interpreted as investment or trading advice. Full terms and conditions can be found at Terms of Use.
A ray of sunshine fell on the markets, with secondary rallies testing resistance across a number of exchanges. Of greater significance is the number of bullish divergences on long-term Twiggs Money Flow, suggesting that a primary trend reversal may not be far off. The signs look promising for at least a strong bear market rally.
When markets reach the 50 percent retracement level, they normally rally. Even the Dow in 1930 rallied from 200 to 290 after the falling from its 1929 high of 386. And the Nikkei 225 rallied from 20000 to 27000 in 1991, after the falling from a high of 39000 at the end of '89. All we can learn from history is that, most of the time, if markets fall 50 percent they will rally — but occasionally, if there has been a complete train wreck, this will be a false dawn. The Dow eventually bottomed at 40 in 1932, while the Nikkei continues to trend lower, reaching 7000 two decades later. The current collapse of the financial markets qualifies as a complete train wreck, but whether I am right about the false dawn is too early to tell.
USA
Dow Jones Industrial Average
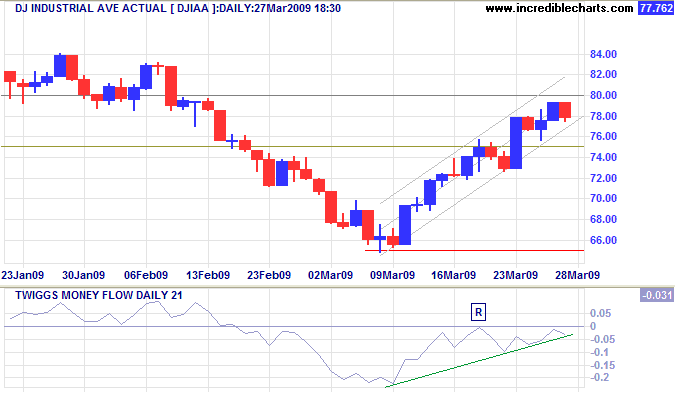
The Dow encountered short-term resistance at 8000, but declining volume indicates limited interest from sellers. Twiggs Money Flow (21_day) continues to respect the zero line from below; penetration of the rising trendline would warn of another down-swing, while breakout above zero would signal continuation of the rally. Buyers are driving the market and a test of 9000 is not out of the question, but long-term sentiment remains bearish and reversal below 6500 would offer a target of 5000.
S&P 500
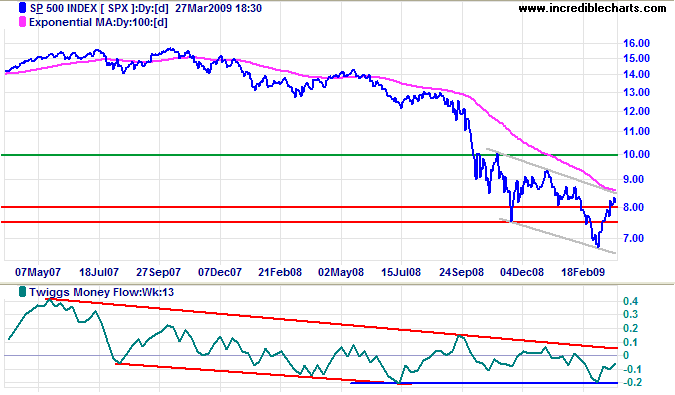
The S&P 500 broke resistance at 800 and is retracing to test the new support level. Respect would signal a rally to 900, while failure would warn of a down-swing to the lower trend channel. In the longer term, breakout above the trend channel would offer a target of 10000. And reversal above 0.1 on Twiggs Money Flow (13-Week) would complete a weak bullish divergence. The primary trend remains down, however, until we see a higher secondary low followed by a new high.
Technology
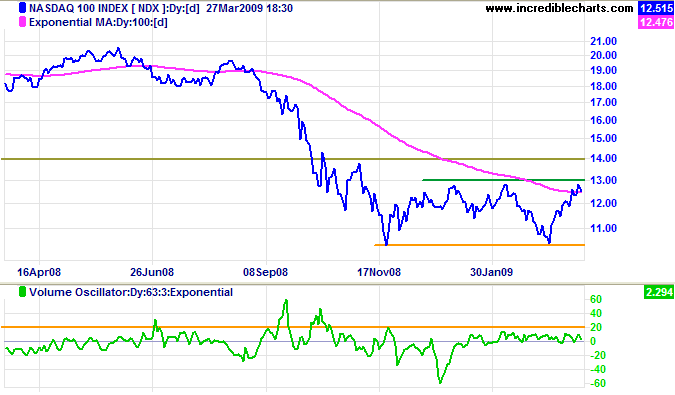
Nasdaq 100 breakout above resistance at 1300 would complete a wide double bottom reversal, offering a target of 1550 (calculated as 1300 + [ 1300 - 1050]). Low volume, indicating light resistance, increases the chance of a breakout. Exercise caution: wait for confirmation from other major indexes.
Canada: TSX
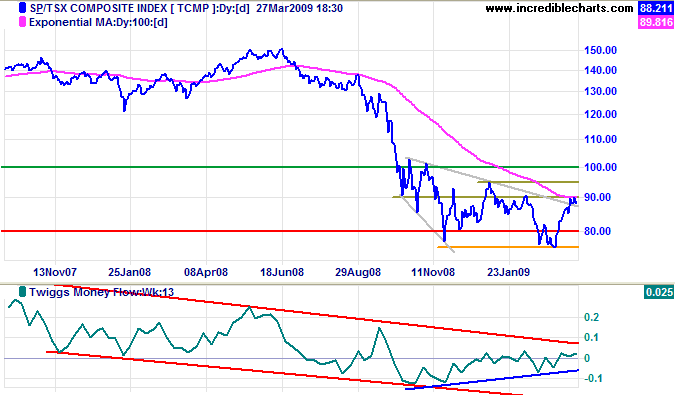
The TSX Composite is testing resistance at 9000 after breaking out of a descending broadening wedge pattern. Thomas Bulkowski has updated his research, indicating that upward breakouts in a down-trend are reasonably reliable and offer a target of the highest point in the pattern — in this case 10000. Bullish divergence on Twiggs Money Flow (13-Week) supports this. And breakout above 9000 would provide additional confirmation.
United Kingdom: FTSE
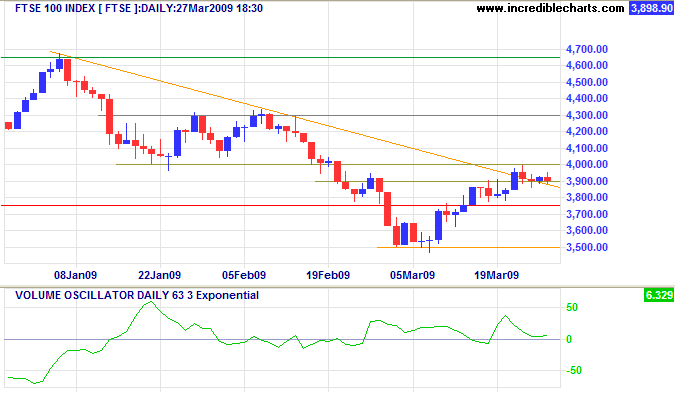
The FTSE 100 consolidating in a narrow range below 4000, and accompanied by falling volume, indicates an advance to 4300. In the long term, however, the primary trend remains down — unless there is a break above 4650, completing a triple bottom reversal.
Europe: DAX
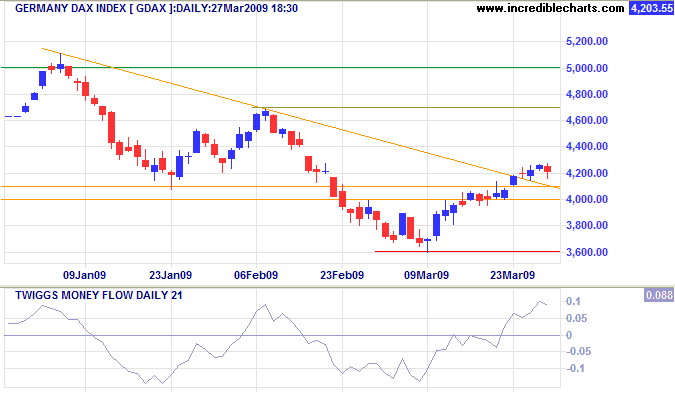
The DAX entered another narrow consolidation after breaking out above 4100; the continuation pattern suggesting a target of 4700. Twiggs Money Flow (21-Day) rising sharply confirms buying pressure.
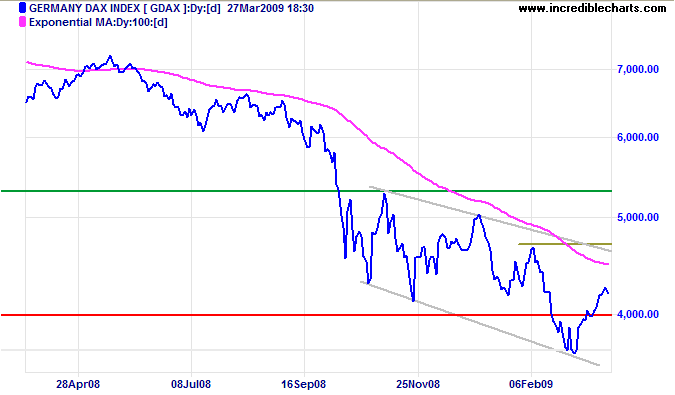
In the long term, breakout above 4700 would offer a target of 5300, the highest point of the descending broadening wedge formation. The primary trend remains down, however, with a target of 3000 (calculated as 4000 - [ 5000 - 4000 ]).
India: Sensex
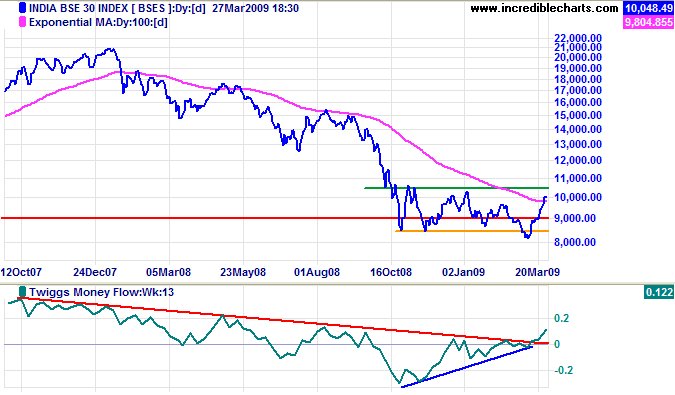
The Sensex shows a strong bullish divergence on Twiggs Money Flow (13-Week), indicating reversal to an up-trend. Breakout above 10500 would confirm. Respect of resistance, however, would warn of another test of 8000.
Japan: Nikkei
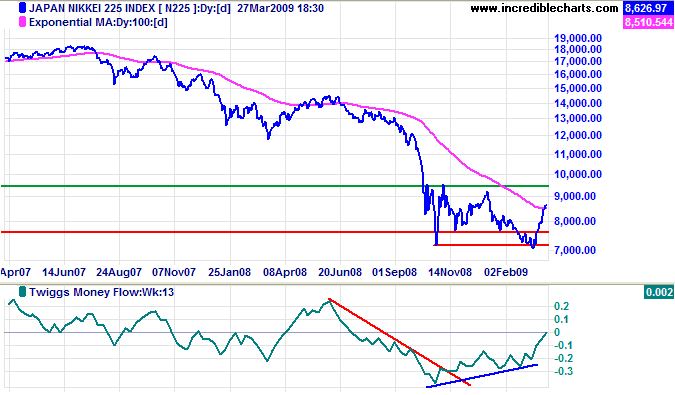
The Nikkei 225 likewise displays a bullish divergence, Twiggs Money Flow (13-Week) having crossed above the zero line. Breakout above 9500 would confirm the primary trend reversal — and offer a target of 12000. Respect of resistance, however, would warn of another test of 7000.
I find the resilience of the Japanese market surprising, considering their recent sharp drop in exports. Fundamentals point to falling corporate profits. Perhaps repatriation of funds by Japanese investors has increased demand for local equities.
China
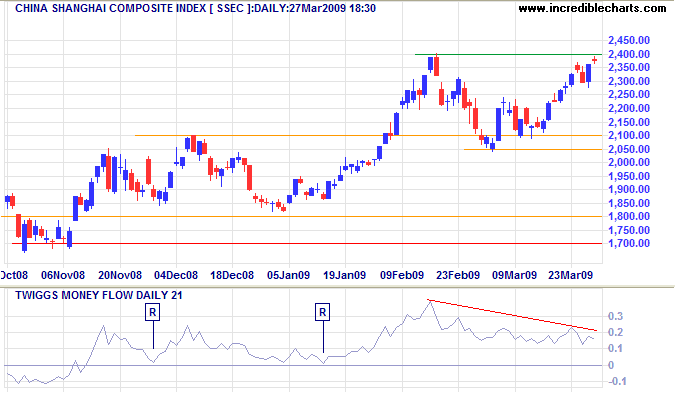
The Shanghai Composite is testing resistance at the February high of 2400. The short retracement is a bullish sign, but heavy volume indicates selling pressure. Breakout would confirm a strong primary up-trend. Reversal below 2050 is unlikely, but would warn that the primary up-trend has weakened.
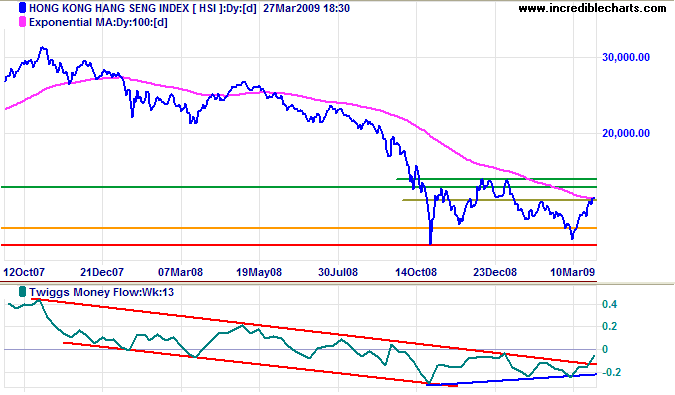
The Hang Seng Index broke through 14000 and is headed for a test of 15500 (the highest green line). Expect short-term retracement to test the new support level. Twiggs Money Flow (13-Week) will complete a bullish divergence if it crosses to above zero, indicating reversal to a primary up-trend. Breakout above 15500 would confirm. Respect of resistance, on the other hand, would signal another test of 11000.
Australia: ASX
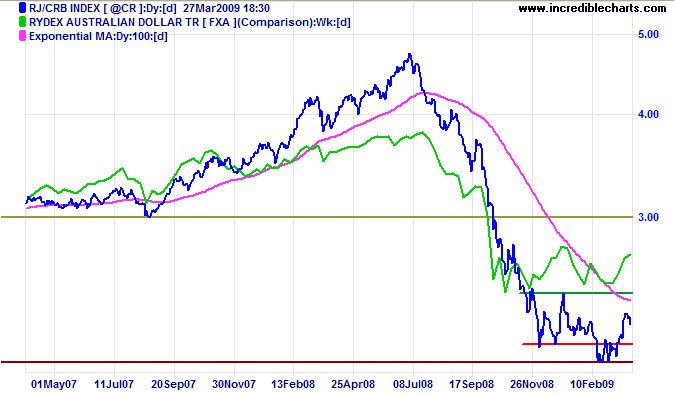
The CRB Commodities Index is retracing to confirm support. Respect of 210 would be a positive sign, while failure of 200 would warn of another down-swing with a target of 180 (calculated as 210 - [ 210 - 180 ]). There are no signs yet of a trend reversal.
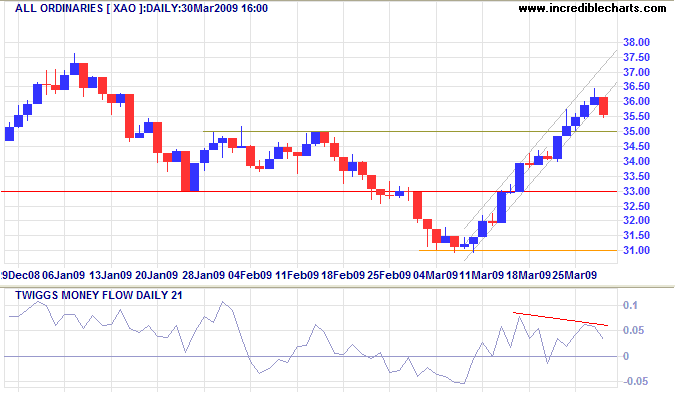
The All Ordinaries is retracing to test support, bearish divergence on Twiggs Money Flow (21-Day) indicating short-term selling pressure. Respect of 3300 would be a bullish sign, while failure of 3100 would test 2700 — the March 2003 low.
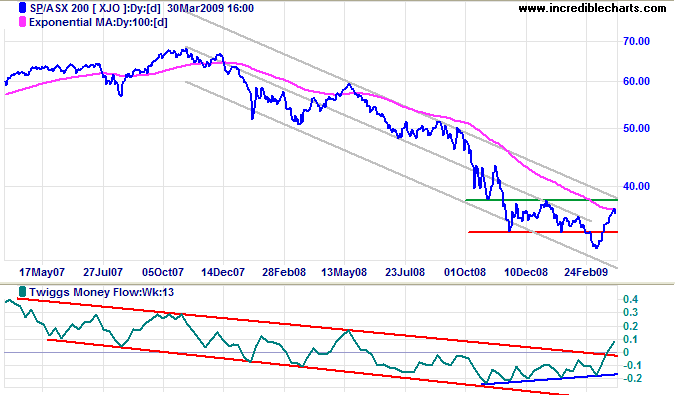
The ASX 200 completed a bullish divergence on Twiggs Money Flow (13-Week), indicating reversal of the primary trend. This would only be confirmed by a higher secondary low followed by a rise above 3800. Expect resistance at 3800; breakout above the trend channel would indicate the primary down-trend is weakening. Until then, the target for the primary down-trend remains the March 2003 low of 2700.
Progress would not have been the rarity it is if the early food had not been the late poison.
~ Walter Bagehot.

Author: Colin Twiggs is a former investment banker with almost 40 years of experience in financial markets. He co-founded Incredible Charts and writes the popular Trading Diary and Patient Investor newsletters.
Using a top-down approach, Colin identifies key macro trends in the global economy before evaluating selected opportunities using a combination of fundamental and technical analysis.
Focusing on interest rates and financial market liquidity as primary drivers of the economic cycle, he warned of the 2008/2009 and 2020 bear markets well ahead of actual events.
He founded PVT Capital (AFSL No. 546090) in May 2023, which offers investment strategy and advice to wholesale clients.
