Gold Divergence Poses A Question
By Colin Twiggs
March 17, 2009 2:30 a.m. ET (5:30 p.m. AET)
These extracts from my trading diary are for educational purposes and should not be interpreted as investment or trading advice. Full terms and conditions can be found at Terms of Use.
Gold
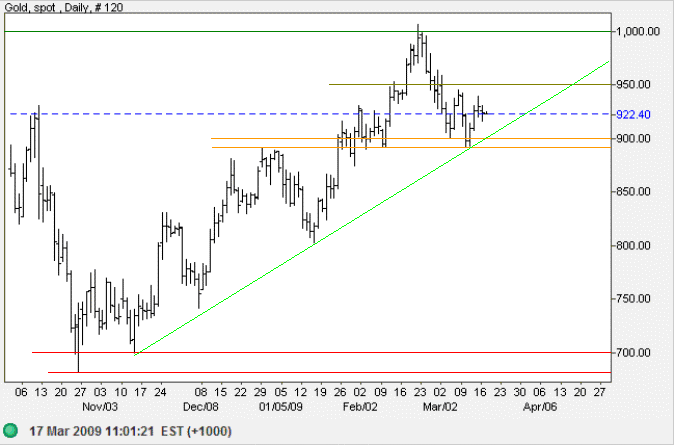
Spot gold is headed for another test of the band of support between $890 and $900. Failure of support would break the rising trendline and warn of a down-swing to test $700. Breakout above $950 would indicate another test of $1000.
Source: Netdania
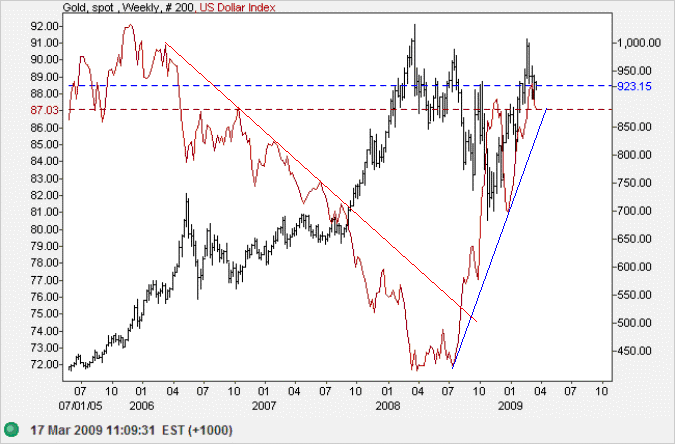
Gold has behaved out of character over the past few months, diverging from its usual relationships. Performance against the dollar is normally inverted: when the dollar strengthens, gold falls — and vice versa. Gold made a typical response from 2006 to mid-2008: making a strong bull trend when the dollar weakened. In late 2008, however, the dollar reversed and started to strengthen. Gold initially weakened, as expected, but then rallied, testing its previous highs — even while the dollar continued to rise.
Source: Netdania
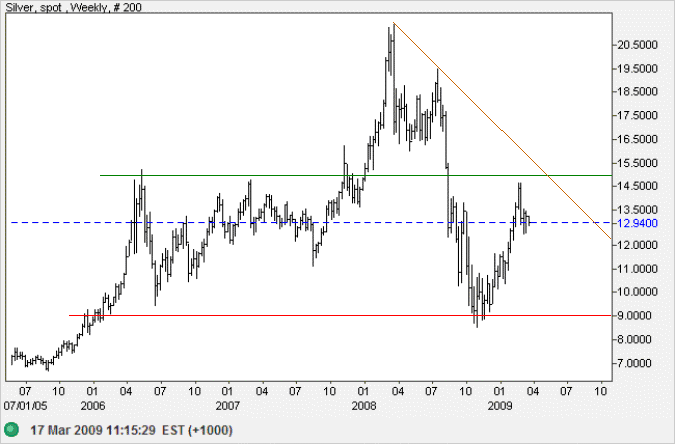
When it comes to precious metals, silver and platinum
normally follow gold closely.
But now the two have diverged from gold, with both in a strong down-trend.
After finding support at $9 silver rallied to $15, but is likely to re-test support
before there is any suggestion of a trend change.
Source: Netdania
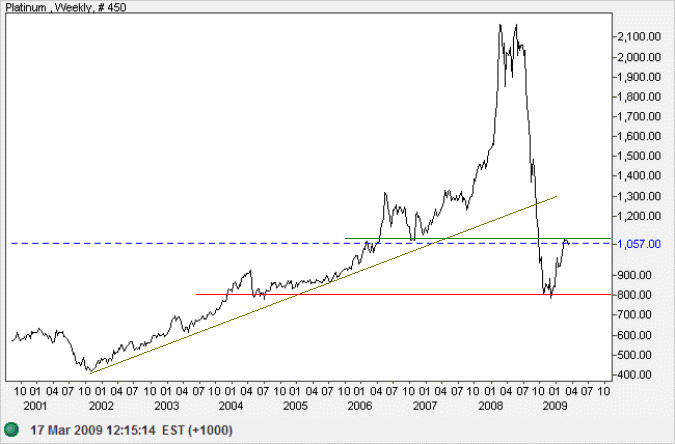
More susceptible to the economic cycle, because of stronger industrial demand, platinum underwent a dramatic fall in 2008. The primary trend is definitely at odds with gold.
Source: Netdania
Crude Oil
Gold and crude oil also tend to support each other, for two good reasons: (1) when oil prices are high, oil producers usually plow some of their profits into gold; and (2) when oil prices are high, inflation is likely to follow — boosting demand for gold as an inflation-hedge.
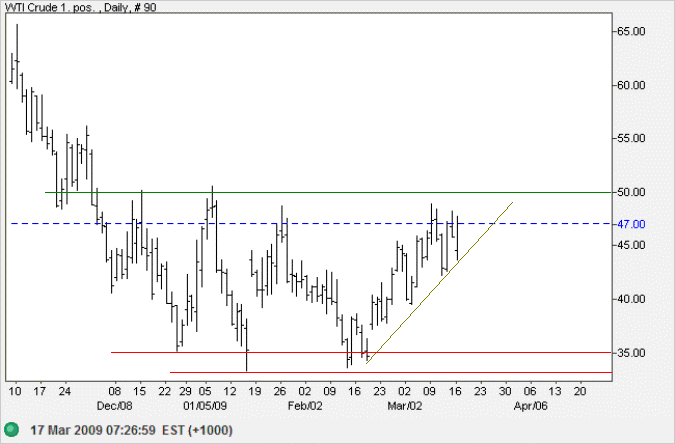
West Texas Crude remains in a primary down-trend despite testing resistance at $50 per barrel. The OPEC decision to leave production quotas unchanged should ensure that resistance holds. Respect of $50 would signal another test of support between $33 and $35 per barrel. In the long term, penetration of support would warn of a down-swing to test the 2003 low of $20. The target is calculated as 35 - (50 - 35).
Source: Netdania
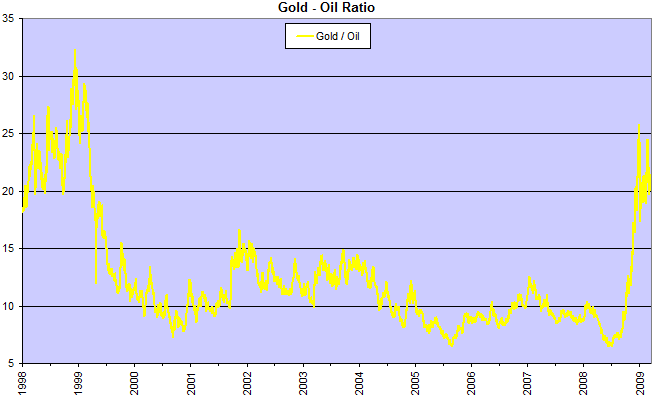
The gold-oil ratio has long been used as an indicator of when to buy or sell gold. A ratio below 10 is taken as a good time to buy, but the current reading, above 20, normally indicates a good time to sell.
Source: Netdania
What All This Means
Gold is rising despite a strong dollar because the investing public are looking for safety — buying both the dollar and gold in their need for security. Crude oil, silver and platinum, however, warn us that something may be amiss. With the collapse of the global debt bubble, we face an extended period of deflation. And while gold is a great inflation hedge, it is a pretty lousy investment during a deflation.
There is an alternative scenario, however, which is driving the current divergence.
If the (US) federal government pulls the inflation lever, gold prices will soar.
Inflation is a tempting solution, especially with massive federal debt, enormous contingent liabilities,
collapsing housing prices, and a banking sector on life support.
The easy way out may be hard to resist.
With liabilities denominated in your own currency, it is a simple matter to give your creditors a "haircut".
Double the money supply and your debts are halved in real terms, house prices miraculously recover and bank collateral will rise from the dead.
There is just one catch, however. Hyper-inflation.
And inevitable collapse of the already-creaking fiat monetary system.
But that would not be bad news for everyone.
If the Fed added a few zeros to their dollar bills, gold bugs would be cheering from the sidelines.
In short, gold is likely to decline as long as we experience deflation, but would quickly reverse in the event that the US starts to "print" money (ie. monetize its debt). That would most likely be flagged by a falling dollar.
Dow Jones Industrial Average
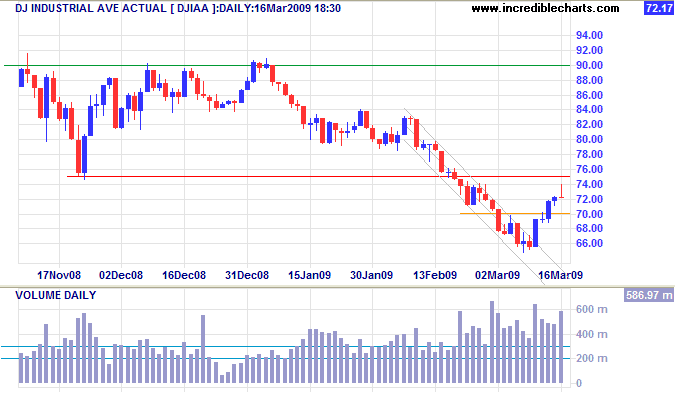
The Dow ran into strong selling before the close,
— signaled by large volume and a tall shadow,
and now appears unlikely to break 7500.
The primary target remains at 6000;
calculated as
7500 - ( 9000 - 7500 ).
United Kingdom: FTSE
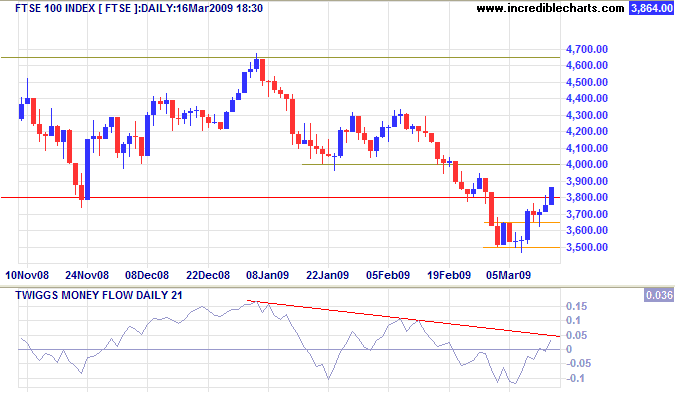
The FTSE 100 closed strongly above resistance at 3800, but is likely to experience "buyers remorse" after witnessing the weak close in the US. Expect a reversal below 3800. The primary target remains at 3000; calculated as 3800 - (4600 - 3800).
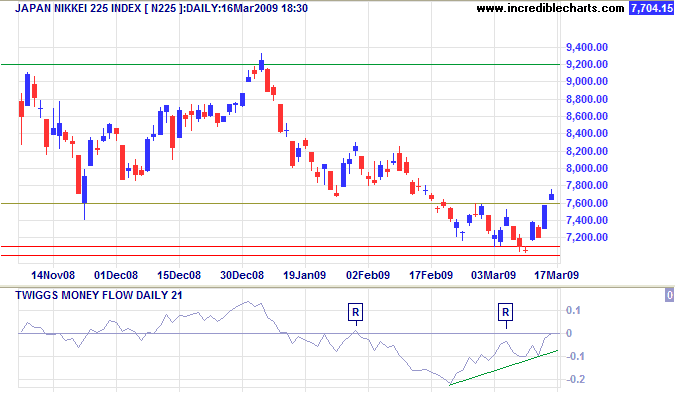
Japan: Nikkei
The Nikkei 225 is also likely to experience some hesitancy after the weak US close. Expect yesterday's gap to close.
Whoever wishes to foresee the future must consult the past; for human events ever resemble those of preceding times.
This arises from the fact that they are produced by men who ever have been, and ever shall be, animated by the same passions,
and thus they necessarily have the same results.
~ Niccolo Machiavelli

Author: Colin Twiggs is a former investment banker with almost 40 years of experience in financial markets. He co-founded Incredible Charts and writes the popular Trading Diary and Patient Investor newsletters.
Using a top-down approach, Colin identifies key macro trends in the global economy before evaluating selected opportunities using a combination of fundamental and technical analysis.
Focusing on interest rates and financial market liquidity as primary drivers of the economic cycle, he warned of the 2008/2009 and 2020 bear markets well ahead of actual events.
He founded PVT Capital (AFSL No. 546090) in May 2023, which offers investment strategy and advice to wholesale clients.
