China Advance Continues
By Colin Twiggs
February 16, 2:30 a.m. ET (6:30 p.m. AET)
These extracts from my trading diary are for educational purposes and should not be interpreted as investment or trading advice. Full terms and conditions can be found at Terms of Use.
Gold
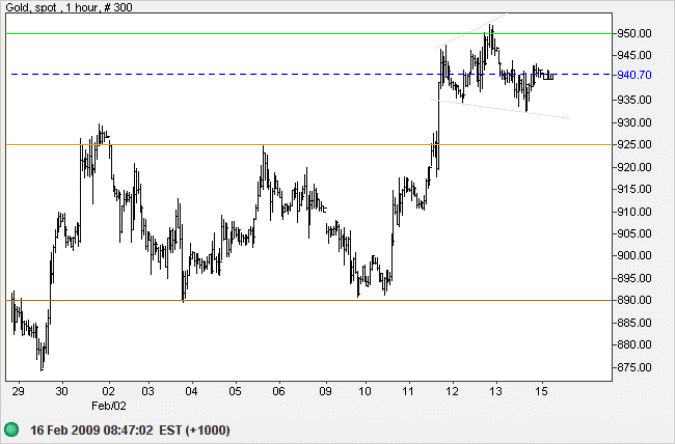
Spot gold is in a broadening consolidation below $950 on the hourly chart — a continuation pattern. Expect a breakout above $950 to be followed by a test of $1000. Reversal below the lower border of the pattern is less likely, but would warn of another test of $890.
USA
Dow Jones Industrial Average
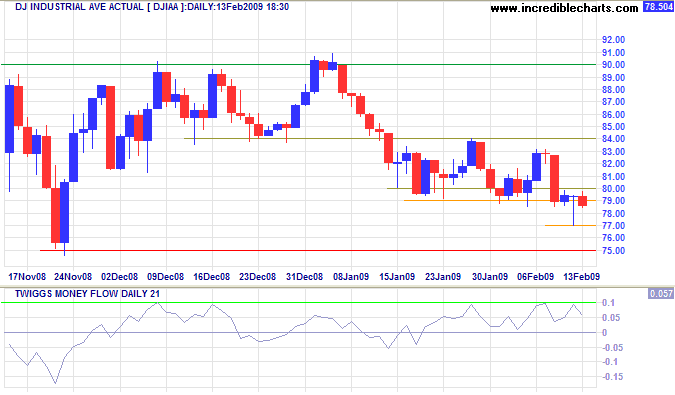
The Dow's Friday close below 7900 signals weakness — following weeks of stubborn support at 7900/8000. But there is no confirmation from the S&P 500, nor Twiggs Money Flow (21-Day) which continues to hold above zero. Confirmation from either, or failure of short-term support at 7700, would signal a test primary support at 7500. Recovery above 8000 is less likely, and would indicate a rally to 8400; possibly 9000.
In the long term, the primary trend is down and breakout below 7500 would offer a target of 6000; calculated as 7500 - ( 9000 - 7500 ). Recovery above 9000 is unlikely in the present circumstances, and would signal a bear market rally with a target of 10000.
S&P 500
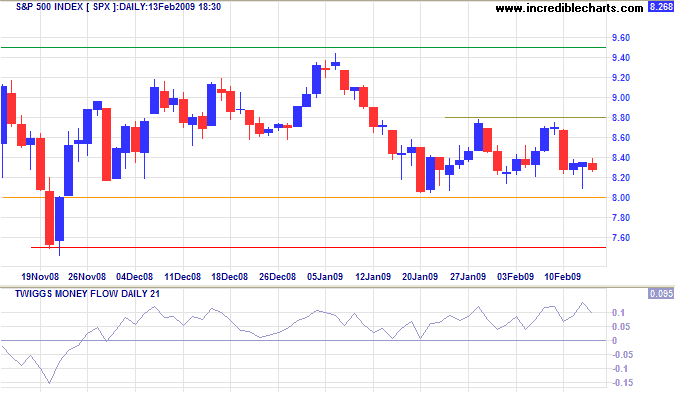
The S&P 500 shows similar Twiggs Money Flow (21-Day) buying support above the zero line. Failure of support at 800 would confirm the Dow bear signal, and test 750; while reversal above 880 would test resistance at 950. In the long term, the primary trend is down and failure of primary support at 750 would offer a conservative target of 600; calculated as 750 - ( 900 - 750 ).
Transport
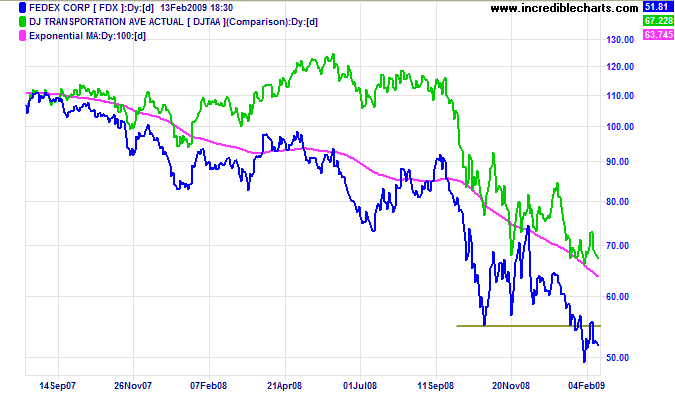
Fedex and the Dow Transport index have commenced another down-swing, signaling further weakness in the economy.
Technology
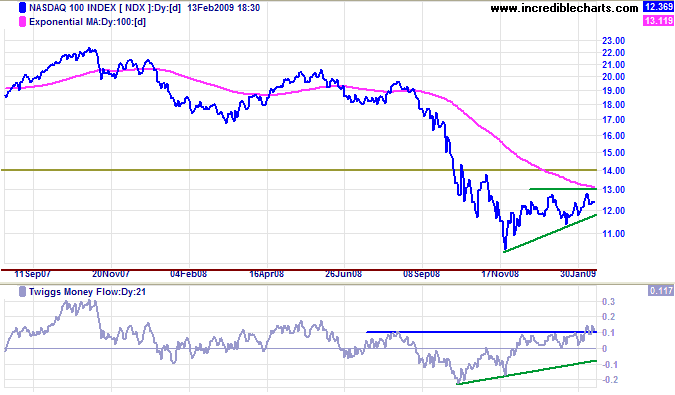
The Nasdaq 100 displays a bullish ascending pattern, with rising lows and equal highs. Twiggs Money Flow (21-day) confirms growing buying pressure with a rise above recent highs at 0.1. Breakout above 1300 is likely, and would offer a target of 1600. Reversal below 1140, while unlikely, would warn of a test of the January low of 1040.
Canada: TSX
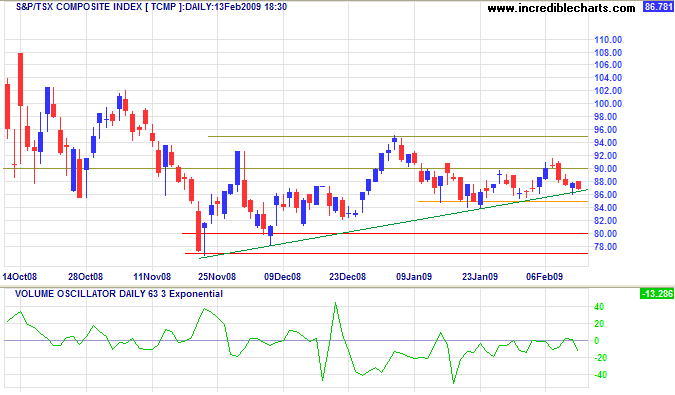
The TSX Composite continues to display uncertainty, consolidating between 8500 and 9000 on low volume. Breakout above 9000 would signal a test of 9500, while reversal below 8500 would test support at 7700/8000. In the long term, the primary trend is down and reversal below 8000 would offer a target of 6500; calculated as 8000 - (9500 - 8000). Recovery above 9500 is unlikely in the present circumstances, but would offer a target of 10500.
United Kingdom: FTSE
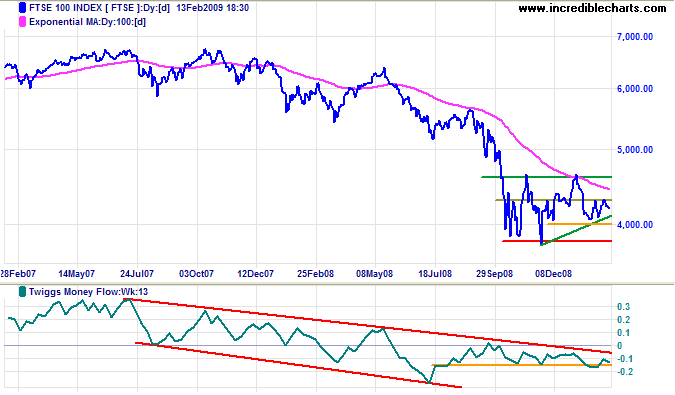
The FTSE 100 also shows hesitancy, consolidating between 4000 and 4300. Twiggs Money Flow (13-Week) has turned down after testing the zero line, signaling long-term selling pressure. Breakout below 4000 is likely, and would test primary support at 3800; while reversal above 4300 would reach 4600. In the long term, the primary trend is down and reversal below 3800 would offer a target of 3000; calculated as 3800 - (4600 - 3800). Breakout above 4600 would indicate a primary trend reversal — most unlikely in the present circumstances.
Europe: DAX
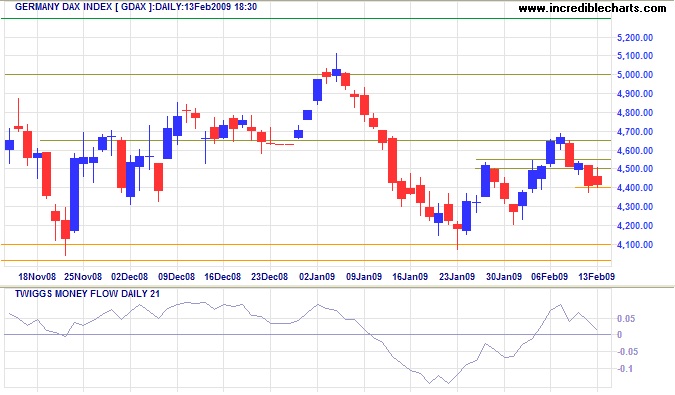
The DAX retracement failed to respect the new support level at 4500, signaling weakness. Twiggs Money Flow (21-day) reversal below zero would warn of selling pressure, and breakout below short-term support at 4400 would confirm. Recovery above 4550, on the other hand would indicate continuation of the secondary rally. In the longer term, the primary trend is down and reversal below support at 4000 would offer a target of 3000; calculated as 4000 - (5000 - 4000). Breakout above 5000 is unlikely, but would suggest a target of 6000.
India: Sensex
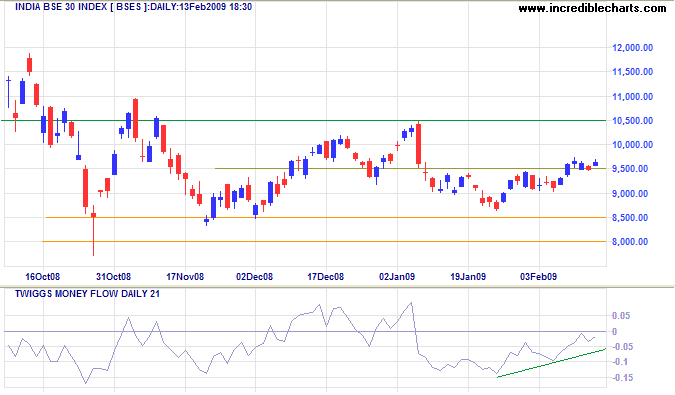
The Sensex broke through resistance at 9500, followed by a short-term retracement respecting the new support level. Twiggs Money Flow (21-Day) recovery above zero would confirm that a test of 10500 is likely. In the long term, the primary trend is down and reversal below 8500 would offer a target of the 2005 low of 6000; calculated as 8500 - ( 11000 - 8500 ).
Japan: Nikkei
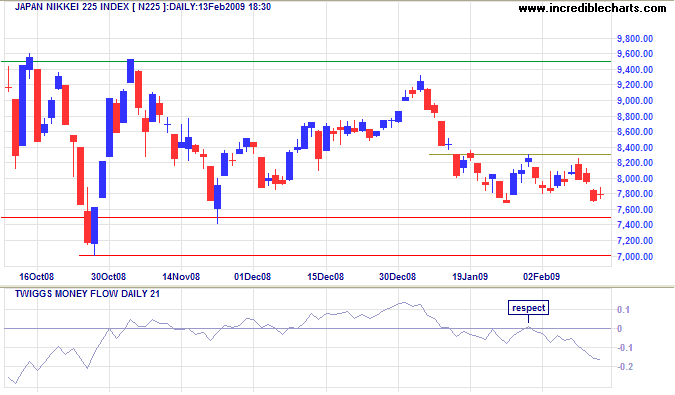
The Nikkei 225 is weaker than most other indexes, with Twiggs Money Flow (21-Day) continuing to respect the zero line from below. Expect a breakout below 7500 to test primary support at 7000. In the longer term, the primary trend is down and failure of 7000 would offer a target of 5000; calculated as 7000 - (9000 - 7000).
China
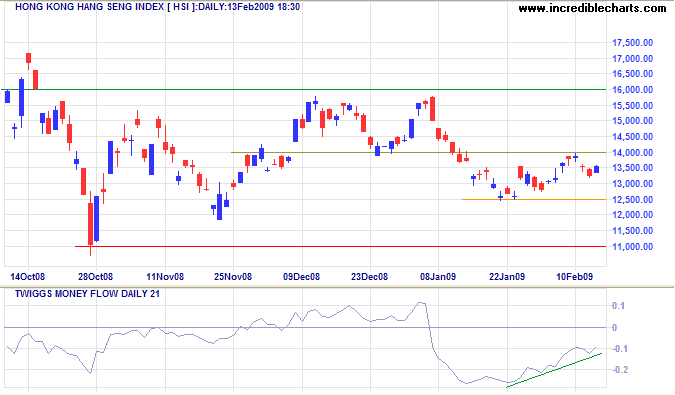
The Hang Seng index is testing resistance at 14000, while rising Twiggs Money Flow (21-Day) signals short-term buying pressure. Breakout above 14000 would indicate a test of 16000. Reversal below 12500, while unlikely at present, would test primary support at 11000. In the longer term, the primary trend is down and breakout below 11000 would offer a target of 8500, the 2003 low. Recovery above 16000 is unlikely, but would offer a target of 21000.
The Shanghai Composite broke through resistance at 2300 after another short retracement — reflecting strong buying pressure. Twiggs Money Flow confirms.
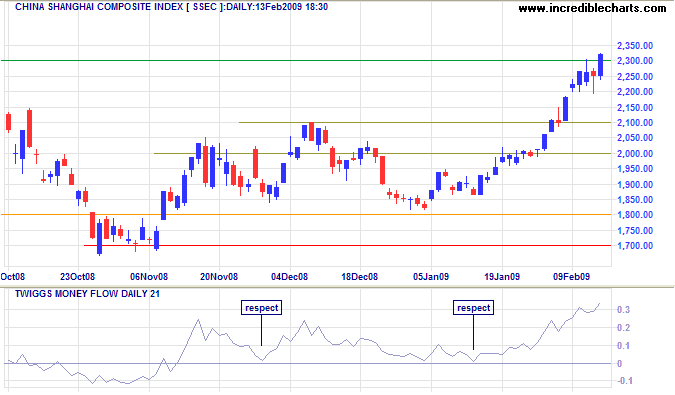
The primary trend reversed upwards in response to easier bank credit and increased infrastructure spending. But it is questionable whether this will be sufficient to overcome a 17.5 percent year-on-year drop in exports, unemployment as high as 20 million, falling housing prices, and declining consumer spending.
Australia: ASX
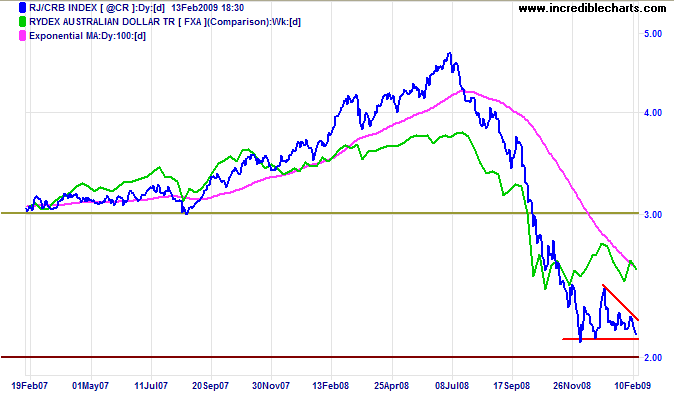
The Baltic Dry Index reflects an upturn in bulk shipping rates, but the CRB Commodities Index has not responded — bearish consolidation above 200 threatening another down-swing.
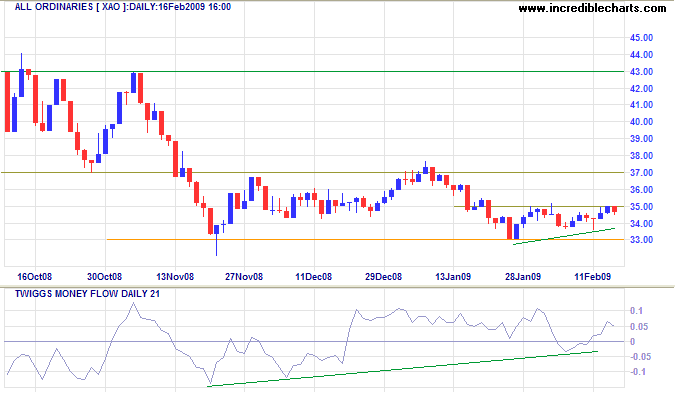
The All Ordinaries continues to test 3500 and Twiggs Money Flow (21-Day) recovered to above zero. Expect a breakout and test of 3700, but negative sentiment from the US could lead to a sharp reversal.
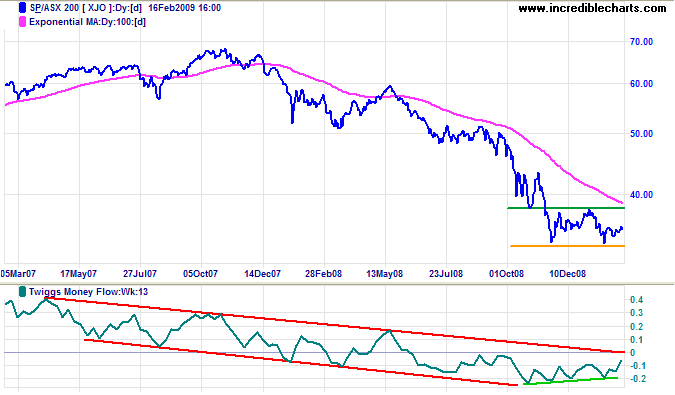
In the long term, both the All Ords and ASX 200 display broad consolidation in a primary down trend. ASX 200 reversal above 3800 would signal a trend reversal, but continuation of the down-trend is more likely. Breakout below 3300 would target the 2003 low of 2700. Recovery above 3800 would offer a target of 4300; calculated as 3800 + ( 3800 - 3300 ). Twiggs Money Flow (13-Week) reversal above the zero line would warn of an impending upward breakout.
If all misfortunes were laid in one common heap whence everyone must take an equal portion, most people would be content to take their own and depart.
~ Socrates

Author: Colin Twiggs is a former investment banker with almost 40 years of experience in financial markets. He co-founded Incredible Charts and writes the popular Trading Diary and Patient Investor newsletters.
Using a top-down approach, Colin identifies key macro trends in the global economy before evaluating selected opportunities using a combination of fundamental and technical analysis.
Focusing on interest rates and financial market liquidity as primary drivers of the economic cycle, he warned of the 2008/2009 and 2020 bear markets well ahead of actual events.
He founded PVT Capital (AFSL No. 546090) in May 2023, which offers investment strategy and advice to wholesale clients.
