Deflation - Good or Bad?
By Colin Twiggs
December 6, 3:00 a.m. ET (6:00 p.m. AET)
These extracts from my trading diary are for educational purposes and should not be interpreted as investment or trading advice. Full terms and conditions can be found at Terms of Use.
We often hear politicians or Fed officials refer to the threat of deflation. Deflation is a natural function of the market to correct excesses from a boom. The boom normally ends when the Fed or central bank halts new money creation — which they have used to artificially stimulate consumption and borrowing. The consequences of their actions threaten an inflationary spiral and leave them with no choice but to desist. This takes the legs out from under an economy which has grown increasingly reliant on new money creation to finance investment — because savings were destroyed by those self-same stimulatory measures.
Consumption and investment both contract as lending slows. Sales fall, putting a further break on new investment. Unemployment rises and orders for raw materials fall. Supply of labor and commodities exceed demand — leading to a fall in commodity prices. Lower prices cause supply to contract until it matches the reduced demand. Falling input costs then result in lower output prices. We witness this all around us: lower oil and gas prices, falling house prices, car dealers cutting prices, Thanksgiving special offers, free shipping, and many other artifices employed by business to attract sales in a falling market. That is deflation.
Labor, unfortunately, is different to other production costs. I use the word "unfortunately" because it causes long-term unemployment and related hardship. Demand for labor may fall, but wages do not easily give ground because of employment contracts, union agreements, unemployment insurance (the dreaded "dole") and minimum wage regulations. Real wages effectively rise if they remain constant while prices fall. President Herbert Hoover boasted in his 1932 re-election campaign of his success in maintaining wage levels. What he had failed to realize is that higher wages do not lead to increased production. That is like pushing on a string. Instead, production falls as profitability declines.
Only increased production is capable of lifting wage levels as demand for labor increases. Maintaining existing wage levels when output prices are falling is short-sighted. While it may benefit those who remain on the payroll, it leads to further layoffs. Producers are forced to cut costs to restore profitability when output prices fall. The impact is two-fold. Banks slow consumer lending through fear of rising defaults — causing further falls in consumption. More critically, businesses fail if they are unable to match shrinking prices and output volumes with unchanged labor costs. Rather than share the pain equally across the entire workforce, those who keep their jobs, despite repeated layoffs, benefit while the rest suffer.
In the Great Depression Hoover attempted to maintain labor rates at 1929 levels, causing massive unemployment. The economy stagnated, with labor rates failing to adjust to levels where production could be restored. The world was only "saved" by the advent of WWII, with increased war production and conscription solving the unemployment problem.
The faster that wages and other input prices are allowed to fall, matching supply costs with the lower output prices, the shorter and less severe the period of temporary unemployment will be. The more attempts are made to retard this process of readjustment, the longer and deeper the recession will be. To the point that it could match President Hoover's folly of the 1930s.
Deflationary Spiral
While deflation is a healthy adjustment process, the real threat is a deflationary spiral, especially after an asset bubble. Falling prices cause bank losses, as we are all too aware. The losses in turn reduce bank reserves — directly through write-downs and indirectly through deposit withdrawals — causing a credit contraction and, in extreme cases, banks calling in existing loans. Leveraged borrowers are forced to sell at fire sale prices — causing further price falls, bank losses, and credit contraction. A self-reinforcing, deflationary spiral.
Progress Report
We may have found a life raft, but we are still in the middle of a storm-tossed sea.
I can see both positive signs and some dangerous developments.
Governments have managed to rescue the global economy from a deflationary spiral by extending deposit guarantees and recapitalizing banks who suffered losses. Attempts to artificially support prices, especially housing, however, are a mistake. They may appeal as a quick fix, protecting banks from further losses, have the opposite effect: prolonging the recession. Artificially supporting prices removes the stimulatory effect that lower prices have on new investment. Instead of a V-shaped bottom followed by a quick recovery, you end up with an L-shaped depression.
Further rationalization of the banks is important. There are still too many dead men walking — even in the too-big-to-fail category. The sooner they are removed, the sooner confidence will be restored. Full disclosure of troubled assets would accelerate the triage process, enabling regulators and creditors to identify which banks are worth saving. Again, recapitalization of the survivors by the taxpayer is essential to avoid a deflationary spiral.
Cutting interest rates to artificially low levels, is both short-sighted and dangerous. We are undergoing a balance sheet recession, with banks and corporations deleveraging. Even low interest rates will not stimulate demand for credit. What they will do in time is discourage savings, eroding long-term support for new investment — and encouraging reliance on undependable new money creation (as discussed earlier). The start of the next boom-bust cycle.
Direct stimulatory measures on the economy come in two forms. The first are tax cuts, tax rebates and payment of bonuses to pensioners — all employed by governments to stimulate consumption. They are short-lived and unsustainable, as evidenced by George Bush's stimulus package earlier in the year. Falling prices are a far healthier method of stimulating the economy: encouraging sustainable investment and long-term employment.
Taxpayers stop squandering their money during a recession so government feels obliged to step in and squander it on their behalf.
Accelerated government spending is wasteful, whether in the form of infrastructure and community programs or otherwise.
The spending is not directed by market forces to where it is really needed and benefit derived by the taxpayer may have little or no relation to the cost.
As I pointed out a few weeks ago, government spending also crowds out private investment,
sacrificing sustainable jobs in the private sector in return for employment on temporary government programs.
It also competes with the private sector for resources,
driving up both wages and input prices,
and destroying the stimulatory effect that lower input prices have on both consumption and new investment.
In turn reducing production and private sector employment.
The only sustainable way to increase prosperity is to improve productivity by expanding the amount of private investment per capita. That is what has succeeded in improving living standards over the last 200 years. All other methods have failed. Especially government "investment" programs. Judging from the actions of some political leaders, you would think that they are ignorant of this fact.
Gold
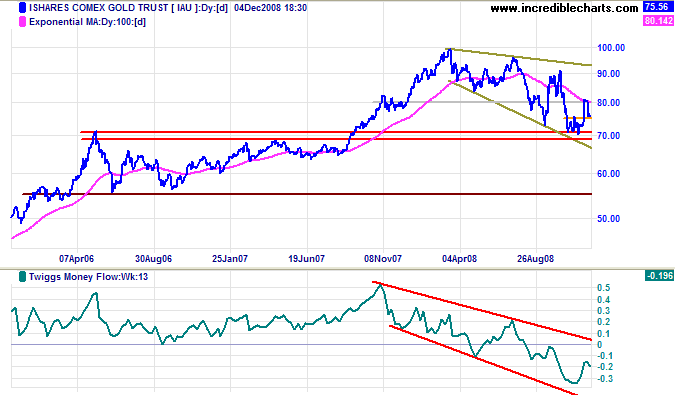
Spot gold is testing medium-term support at $750. Failure would indicate another test of $700. In addition it completes another failed swing in the bearish descending wedge formation — signaling a downward breakout and test of the June 2006 low of $550.
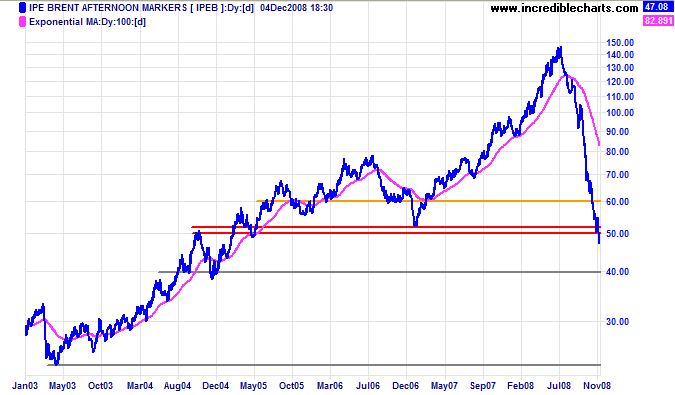
Crude oil broke through support at $50 per barrel and is headed for a test of the December 2004 low at $40. If that fails, the next major support level is the 2003 low of $25.
Interbank Lending
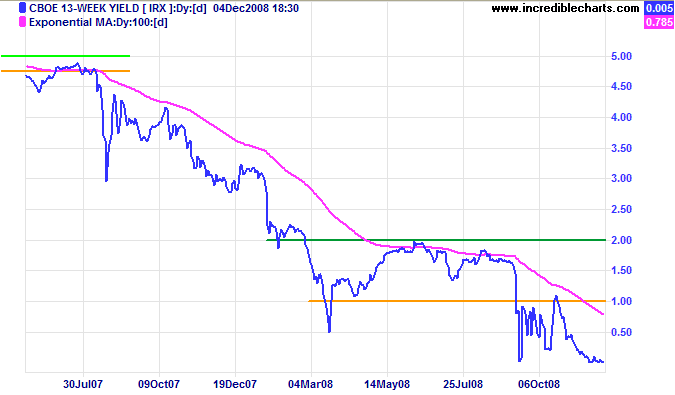
Yields on 3-month Treasury Bills are close to zero, signaling that financial markets remain in distress — with investors seeking safety rather than yield.
Why All This Doom And Gloom?
You can fool some of the people some of the time,
but not all of the people all of the time.
A reader asked me to explain why the Dow is holding up so well despite all the bad news in the market place.
My only answer is to point to the Dow peak in October 2007.
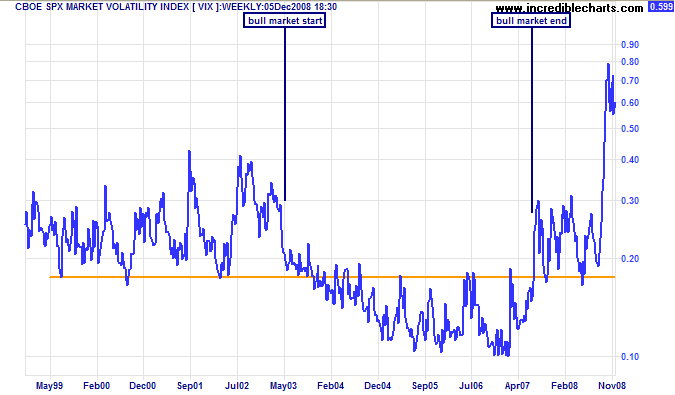
If you look at the VIX you will see that volatility increased in July 2007 when the subprime crisis hit the headlines,
but the Dow continued to rise for another 3 months before it crashed.
The market may be manipulated in the short to medium term, but is too powerful to resist in the long term.
Sucker rallies, as in early 1930 and in late 2001,
are a recurring feature in bear markets.
Our natural instinct tells us that if price has halved it must now be cheap. Experience, however, has taught us not to trust our natural instincts. Value investors are salivating over forward and historic price earnings ratios which lead them to believe that they are looking at a bargain. Unfortunately, forward earnings are unlikely to resemble past earnings for quite some time (refer to my earlier comment on deflation). Forward earnings are also unlikely to resemble forecast earnings for some time: analysts are notoriously poor at forecasting earnings in a down-turn. As are management, to whom they listen closely. Management are eternal optimists — accepting that there will be a down-turn, but seldom believing that they will be seriously affected.
Experienced value investors take a 5 year average of earnings and compare this to the current price, arguing that any fall in earnings will be of a temporary nature. But this is only true if we experience a V-shaped bottom, with a quick recovery. The current recession runs the risk of forming an L-shaped bottom, where earnings are not restored for some time.
USA
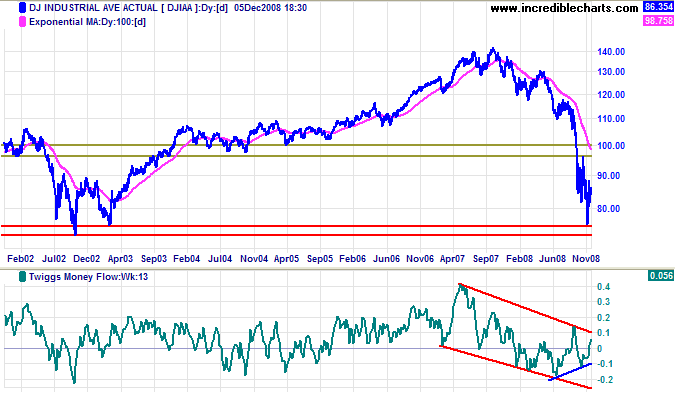
Dow Jones Industrial Average
The Dow found short-term support at 8000, with Twiggs Money Flow (21-day) rising above zero for the first time in a month. Breakout above medium-term resistance at 9000 would signal another test of 10000. Reversal below 8000 would indicate a test of 7300.
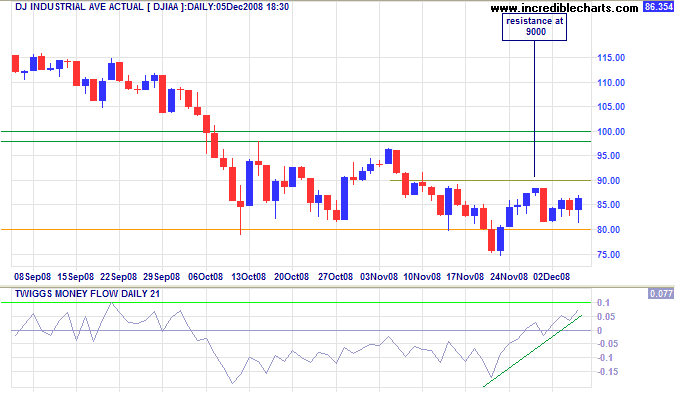
Long Term: The primary trend is down and any rally is likely to be of the sucker variety. Penetration of the 2002 low of 7300 would offer a long-term target of 6000; calculated as 8000 - ( 10000 - 8000 ). Twiggs Money Flow (13-Week) shows a bullish divergence, but is yet to be confirmed by breakout from the downward trend channel. It is important not to approach the market with any preconceived ideas, but I cannot see a primary trend change in the short or medium term. I would treat any bear market rally with suspicion. If it had to break through primary resistance at 9600, a large correction, it would be prudent to wait for confirmation from a higher trough followed by a new high.
S&P 500
The VIX, reflecting volatility on the S&P 500, is at record levels — in accordance with the current state of anxiety.
A fall below 50 or 40 would not necessarily signal a trend reversal.
Only a fall below 17.5.
Transport
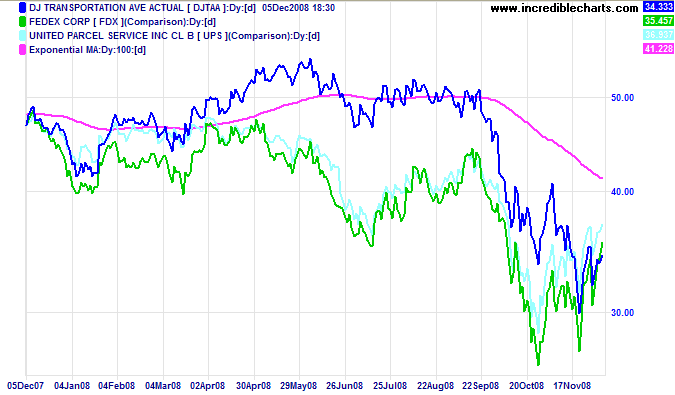
Fedex and UPS are rising in response to lower fuel prices. While FDX signals a primary trend change, neither UPS nor the Transport index confirm. An up-turn in economic activity remains some way off. A far more reliable indicator would be the physical volume of parcels delivered by Fedex and UPS. Unfortunately it is hard to get up-to-date data.
Canada: TSX
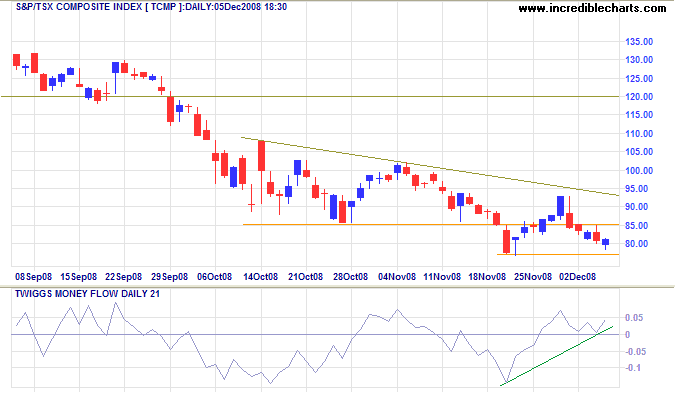
The TSX Composite signals short-term buying pressure, with Twiggs Money Flow (21-Day) holding above zero. Expect a test of the descending trendline. The primary trend is down, however, and reversal below 7700 would offer a target of 6000, calculated as 8000 - (10000 - 8000).
United Kingdom: FTSE
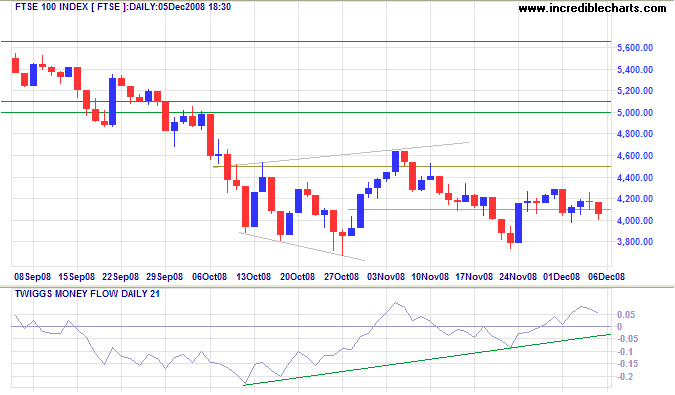
The FTSE 100 continues in a large consolidation between 3800 and 4600, signaling uncertainty. The primary trend is down and likely to persist. Twiggs Money Flow (21-day) rising above zero signals short/medium-term buying pressure. In the long term, breakout above 4600 would signal a bear market rally, with a target of 5600, the September 2008 high. Breakout below 3800 would signal a primary down-swing, with a target of 3000; calculated as 3800 - (4600 - 3800).
Europe: DAX
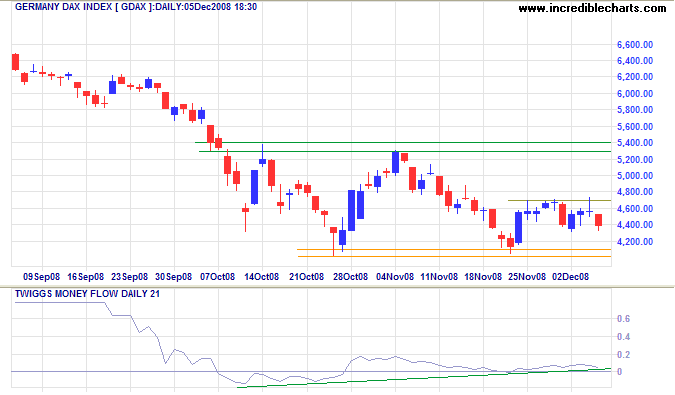
The DAX displays a similar consolidation — between 4000 and 5300. Twiggs Money Flow (21-day) holding above zero signals short/medium-term buying pressure. Breakout above short-term resistance at 4700 would test 5300. In the longer term, breakout above 5300 would signal a bear market rally with a target of 6500, calculated as 5300 + (5300 - 4100); while breakout below 4000 would offer a target of 3000, calculated as 4200 - (5300 - 4100).
India: Sensex
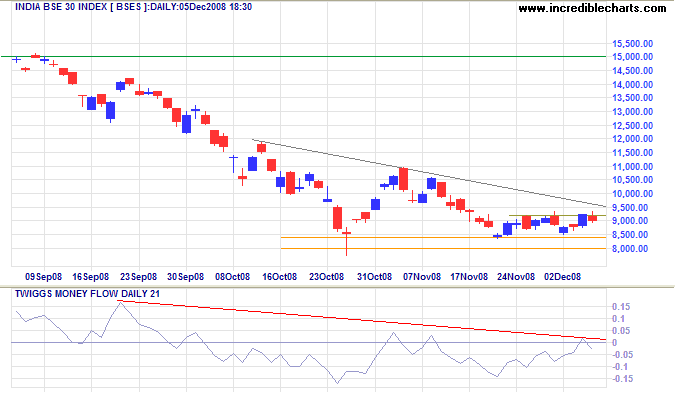
The Sensex is consolidating in a narrow range above resistance at 8400, warning of a downward breakout. The descending triangle is bearish, and breakout below 8400 would be likely to test the 2005 low of 6000. The target is calculated as 8500 - ( 11000 - 8500 ). Twiggs Money Flow (21-Day) holding below zero, indicates selling pressure. The primary trend is down and unlikely to reverse in the present climate.
Japan: Nikkei
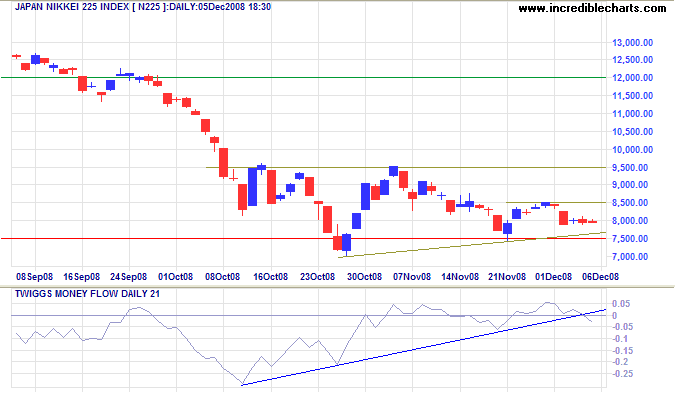
The Nikkei 225 is headed for a test of support at 7500. Breakout would offer a target of 4500, calculated as 7000 - (9500 - 7000). Twiggs Money Flow (21-Day) reversed below zero, signaling short-term selling pressure. Recovery above 8500 is less likely and would test 9500. The primary trend is down and unlikely to reverse in the present climate.
China
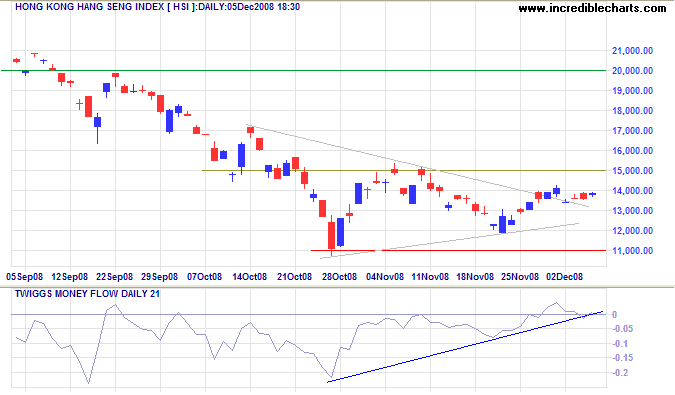
The Hang Seng index, consolidating short term in a narrow line below 14000, signals a test of 15000. The breakout from the apex of the triangle does not offer reliable signals. Twiggs Money Flow (21-Day) holding above zero indicates short-term buying pressure. In the longer term, breakout above 15000 would offer a target of 20000. Reversal below 11000 would suggest a target of 8500, the 2003 low.
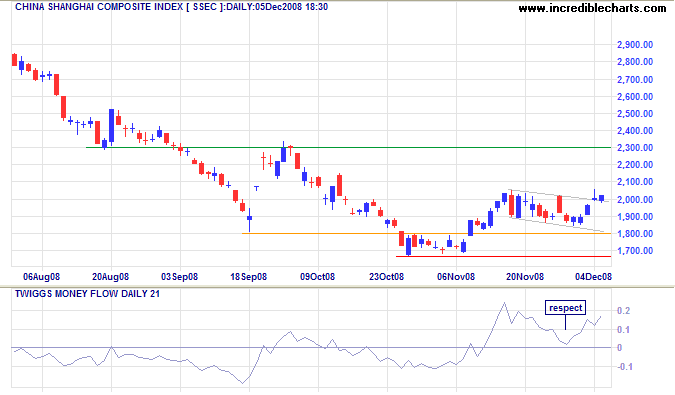
The Shanghai Composite broke out from its descending flag formation, signaling continuation to 2300. Twiggs Money Flow (21-Day) respected the zero line from above, indicating strong short/medium-term buying pressure. In the long term, breakout above 2300 would signal reversal of the primary trend. Large corrections, however, have proved unreliable in the past and it may be prudent to wait for confirmation from a higher trough followed by a new high. Breakout below 1650 would offer a target of 1300; calculated as 1650 - (2000 - 1650).
Australia: ASX
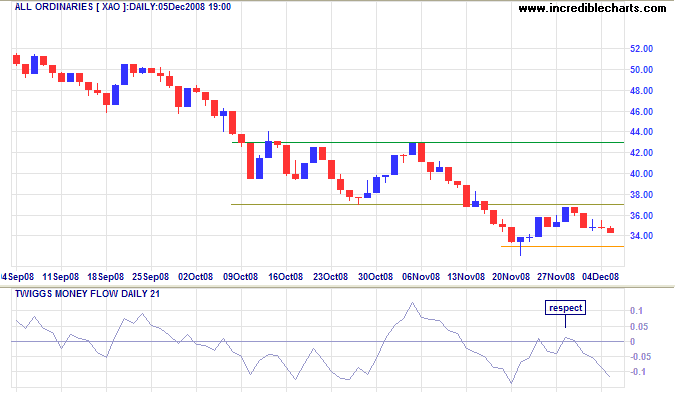
The All Ordinaries respected resistance at 3700, signaling a down-swing to 2700. Twiggs Money Flow respected the zero line from below, confirming strong selling pressure. Penetration of support at 3300 would provide further confirmation.
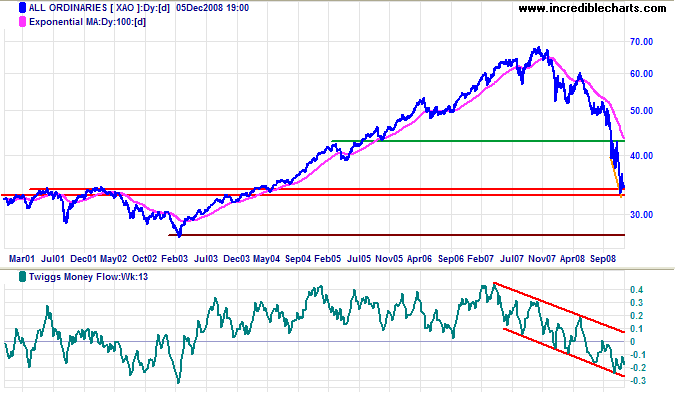
Long Term: Twiggs Money Flow (13-week) continues in a strong downward trend channel. The primary down-trend is likely to continue and breakout below 3300 would confirm the target of 2700, the 2003 low.
For the first time in the history of depression, dividends, profits, and the cost of living, have been reduced before wages have suffered....
They were maintained until the cost of living had decreased and the profits had practically vanished. They are now the highest real wages in the world.
~ Herbert Hoover, August 1932

Author: Colin Twiggs is a former investment banker with almost 40 years of experience in financial markets. He co-founded Incredible Charts and writes the popular Trading Diary and Patient Investor newsletters.
Using a top-down approach, Colin identifies key macro trends in the global economy before evaluating selected opportunities using a combination of fundamental and technical analysis.
Focusing on interest rates and financial market liquidity as primary drivers of the economic cycle, he warned of the 2008/2009 and 2020 bear markets well ahead of actual events.
He founded PVT Capital (AFSL No. 546090) in May 2023, which offers investment strategy and advice to wholesale clients.
