Gold Weakens & What's New
By Colin Twiggs
December 2, 2008 6:00 a.m. ET (10:00 p.m. AET)
These extracts from my trading diary are for educational purposes and should not be interpreted as investment or trading advice. Full terms and conditions can be found at Terms of Use.
What's New
You can now share stock screens with other Incredible Charts Users

Click on your Saved Screens tab.
- The Share command will add your saved screen to the public domain where it can be viewed or copied by other users. Any screens that you share are highlighted in teal/green.
- The Hide command will remove your shared screen from the public domain so that it can no longer be viewed or copied by other users.
Shared Screens
The Shared Screens tab offers you the option to select a shared screen from the list or search for a shared screen that meets specific criteria.

- Click on the Search icon to open the search window;
- Click on the left/right arrows to scroll through the pages of shared screens; and
- Select Run to run the shared screen or View to display or modify the shared screen filters.
Search
We recommend that you use the Search function to find screens that meet your criteria.

- If you know the ScreenID number (e.g. 1890), enter the value and click Search;
- To search by date, use the yyyy-mm-dd format (e.g. 2008-11-20);
- Search by Author name (e.g. "Colin") or generic terms such as "Trend" in the title field; and/or
- Search for specific filters using the drop-down list.
Gold
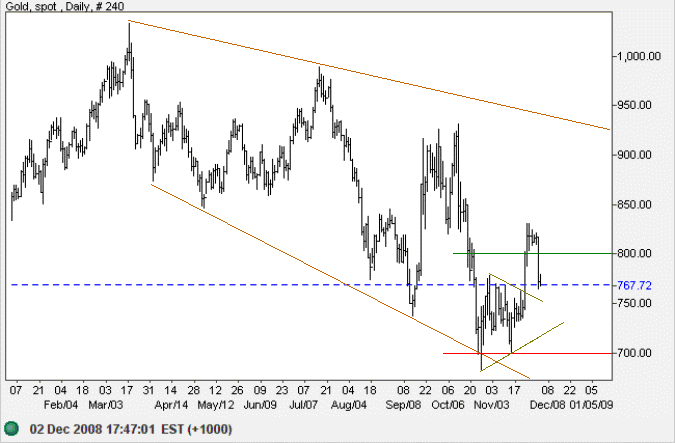
After a brief consolidation, spot gold fell sharply through support at $800, heading for a test of $750 (the upper border of the pennant). The sharp reversal is a bearish sign and a test of $700 is now likely. Recovery above $800, while unlikely, would negate this.
Source: Netdania
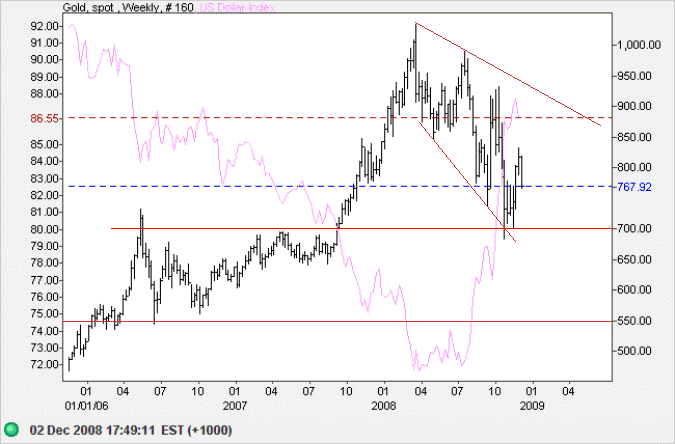
On the long term chart, the US Dollar Index continues to strengthen, indicating that gold is likely to remain in a down-trend. Gold reversal to $700 would mean another up-swing failed to test the upper border of the long-term broadening descending wedge formation — signaling a downward breakout and test of the June 2006 low at $550.
Crude Oil
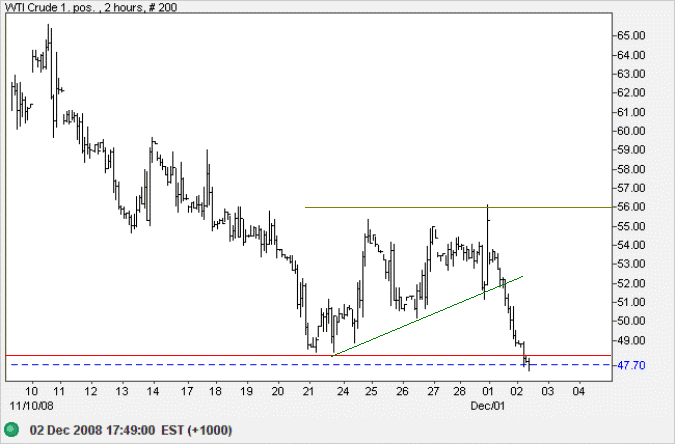
West Texas Intermediate Crude broke through support at $48, the 2007 low. Expect a test of $40; calculated as 48 - (56 - 48).
Source: Netdania
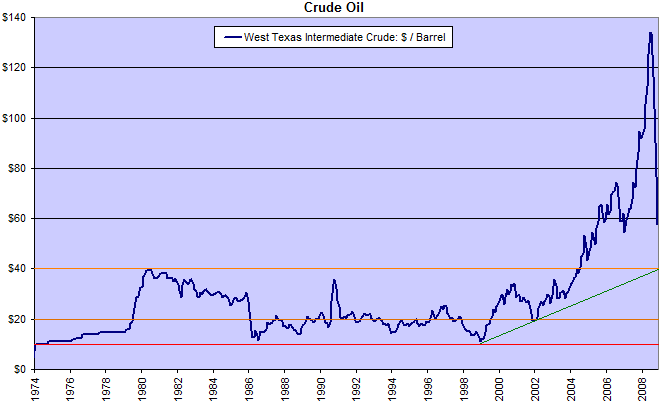
OPEC production cuts have so far had little effect. In the long term, if support at $40 fails, the next major level is $20, the 2002 low.
Currencies
Euro
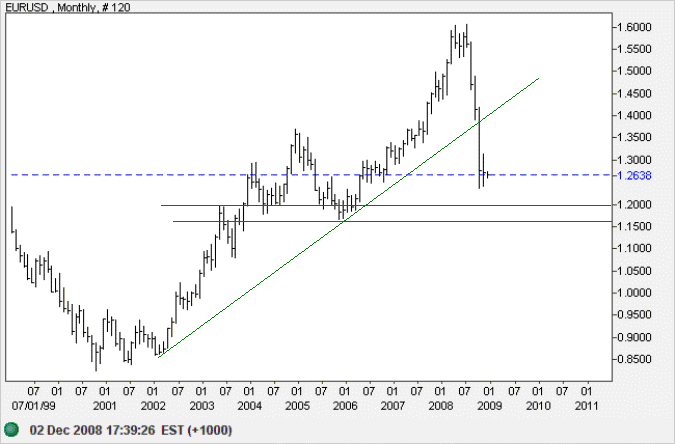
The euro continues to consolidate around $1.25, forming a symmetrical triangle. Expect a test of primary support at the 2005 low of $1.16.
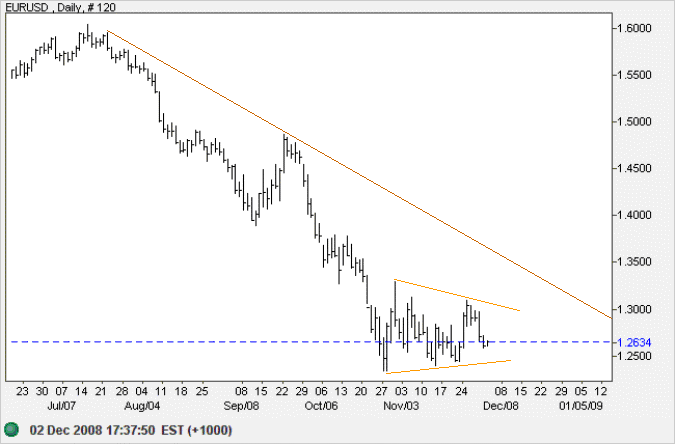
In the medium to long term, failure of support at $1.15 would offer a target of parity. Calculated as 1.15 - (1.30 - 1.15).
Source: Netdania
Japanese Yen
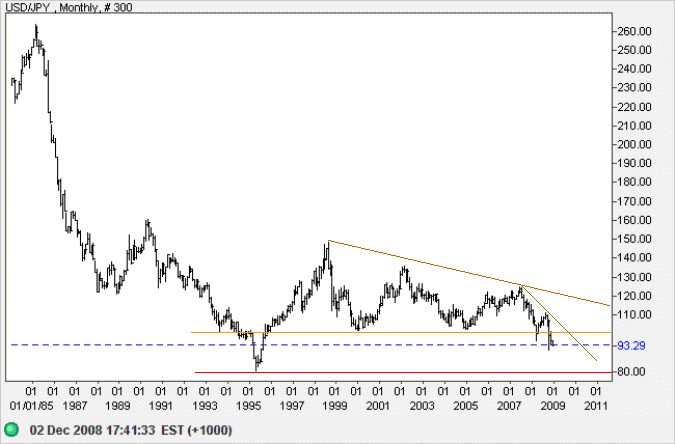
The dollar fell below 94 yen, warning of another test of the October low of 91. In the longer term, the primary trend is down, with a target of the 1995 low of 80.
Source: Netdania
Australian Dollar
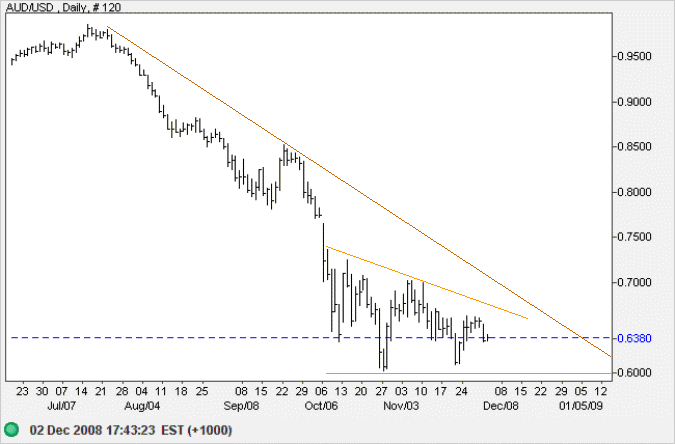
The Australian dollar continues in a descending triangle against the greenback,
with the RBA attempting support at $0.60.
Today's interbank cash rate cut to 4.25% will add further weakness.
Breakout below $0.60 is more likely — and would offer a target of $0.50.
Calculated as
0.60 - (0.70 - 0.60).
Source: Netdania
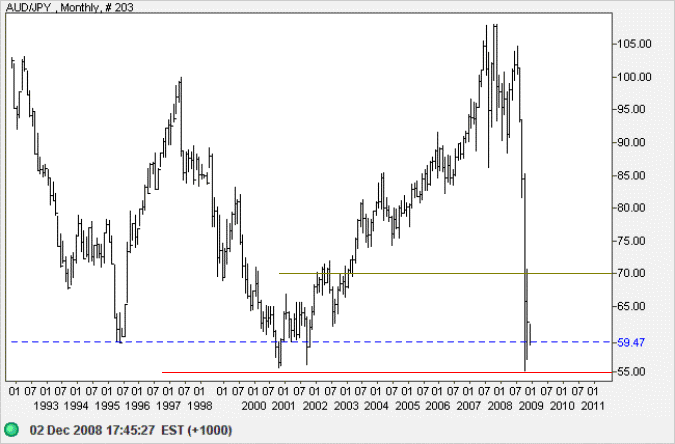
The Aussie Dollar is faring even worse against the yen, testing long-term support at 55. Breakout would offer a target of 40; calculated as 55 - (70 - 55).
Source: Netdania
Human beings, who are almost unique in having the ability to learn from the experience of others, are also remarkable for their apparent disinclination to do so.
~ Douglas Adams

Author: Colin Twiggs is a former investment banker with almost 40 years of experience in financial markets. He co-founded Incredible Charts and writes the popular Trading Diary and Patient Investor newsletters.
Using a top-down approach, Colin identifies key macro trends in the global economy before evaluating selected opportunities using a combination of fundamental and technical analysis.
Focusing on interest rates and financial market liquidity as primary drivers of the economic cycle, he warned of the 2008/2009 and 2020 bear markets well ahead of actual events.
He founded PVT Capital (AFSL No. 546090) in May 2023, which offers investment strategy and advice to wholesale clients.
