Layers Of Complexity
By Colin Twiggs
November 29, 1:00 a.m. ET (4:00 p.m. AET)
These extracts from my trading diary are for educational purposes and should not be interpreted as investment or trading advice. Full terms and conditions can be found at Terms of Use.
What do a nuclear power plant, an aircraft, a ship at sea, and financial markets have in common? They are all complex systems with layers of safety measures intended to protect the system from catastrophic failure. Richard Bookstaber, a Wall Street risk management specialist, points out that the very safety measures intended to protect the system, add to the complexity and make unforeseen failures more likely.
There is another common feature: all the above systems are tightly coupled. Failure of one component or safety measure can impact on others in an unforeseen manner — with catastrophic results. This is where complexity bedevils the process, hiding points of failure from sight until the system is out of control.
A simple example is the fuel gauge on an aircraft. A much-needed safety measure, the gauge warns the pilot when his fuel is running low. But if the pilot comes to rely on the fuel gauge to tell whether his tanks are full at take-off, a faulty gauge could lead to disaster. The safety measure, the fuel gauge, adds a layer of complexity that may hide a half-empty fuel tank until the flight is over the Atlantic. Multiply this simple example by thousands of times and you will have an idea of the complexity of any of the above systems.
USS Forrestal

USS Forrestal
The deck of an aircraft carrier at launch time is a highly complex system with tightly coupled events. Aircraft are raised from the hangar below on giant lifts, to the flight deck where they are fueled and armed before being launched from a steam-powered catapult. Witnessing such an event gives an insight into the months of drills and planning that enables the carrier to function as a well-organized system. There are few gridlocks and arguments about procedure. Everyone knows their job. Layers of safety measures are in place to prevent failure of one component in the system from impacting on others.
Unfortunately, the complexity of the system increases the likelihood of unforeseen events. The USS Forrestal is a classic example. Operating in the Gulf of Tonkin during the Vietnam war, the carrier experienced a massive fire on its flight deck, claiming the lives of 134 crewmen and injuring many others. The worst fire in post WWII US naval history.

Photo of the fire aboard the U.S. Navy aircraft carrier USS Forrestal (CVA-59) on 29 July 1967 off Vietnam.
Source https://en.wikipedia.org/wiki/1967_USS_Forrestal_fire (original source USS Forrestal 1967 cruise book)
A surprising twist is that one of the few on the flight deck who witnessed the disaster and managed to escape unscathed was a young navy pilot, LCDR John McCain.

LCDR John McCain (right) with squadron (1965).
Source US Navy - Library of Congress: https://lcweb2.loc.gov/diglib/vhp-stories/loc.natlib.afc2001001.07736/
Post-fire investigations revealed an unlikely sequence of events precipitated by reliance on some of the very safety measures intended to prevent such an occurrence. An electrical surge, when switching from standby to internal power, triggered a rocket mounted in a pod under the wing of an F4 Phantom jet being prepared for take-off. The rockets were not supposed to be armed until later in the launch sequence, but a large red tag, added to the electrical safety pins to make them more visible, had caused the pin to become dislodged in high winds on the carrier deck. That on its own would not have caused the disaster. There was a backup safety measure: the "pigtail" electrical connection to the rocket pod is only meant to be connected when the jet is mounted on the catapult, ready for launch. But launch delays caused by faulty connections had persuaded the weapons safety board to agree that "pigtails" be connected earlier, while the aircraft were queued on the flight deck. They were unaware of the potential danger from an electrical surge — because safety procedures had until then masked this potential threat.
A third safety measure, preventing rockets from detonating at close range, also failed to avert the disaster. The rocket struck the fuel tank on one of two Skyhawks being fueled on the opposite side of the flight deck. It failed to detonate, as designed, but punctured the fuel tank, igniting the contents. McCain and several other pilots managed to scramble from their cockpits and jump to safety.
Fire crews, on standby for just such an occurrence, moved to extinguish the blaze before it could spread. But events had conspired against them. Two 1000-pound bombs had been dislodged from the Skyhawk and lay on the burning deck. The crew were trained for just such an eventuality and knew that the ordnance was designed to withstand intense heat for at least 2.5 minutes, giving them sufficient time to quell the blaze. This is where their luck ran out. Due to a particularly heavy bombing campaign the Navy was running short of ordnance and had switched to Korean War vintage bombs that lacked the same heat resistant properties. One of the bombs detonated, wiping out the fire crews and setting off a further chaotic chain of fires and explosions, causing massive loss of life and nearly sinking the ship.
Financial Markets
"What does this have to do with financial markets?" you may ask. Bookstaber, in his book A Demon Of Our Own Design, illustrates how complex trading strategies employed by banks and broker dealers, hedged using non-standard financial derivatives traded in over-the-counter markets, can have unforeseen consequences similar to disasters in other complex, tightly-coupled systems. An institution's need to liquidate its position in one financial instrument may impact not only on that market, but on other financial instruments as well. Attempts to extricate from complex trading positions can cause liquidity problems, and resultant price falls that provoke further selling — in order to meet capital or liquidity requirements. Setting off a downward spiral. Counterparties may withdraw, not only from the market for a particular instrument, but from other markets where the seller has known exposure — either to take advantage of falling prices or through fear of a downward spiral. This merely reinforces the liquidity squeeze.
Bookstaber's solution is simple. You cannot make complex systems safe by additional regulation or safety measures. These merely increase the risk of unforeseen events. The only way to make complex systems safe is by simplifying them. In financial markets that means standardizing derivative products and trading through a formal exchange. It also means restricting leverage in order to limit the impact of individual failures. In addition, we can simplify the structure of complex institutions and require stronger capital-asset ratios to protect against failure. I also see no reason why standards should not be higher for large institutions in the too-big-to-fail category.
The Economy
The global economy is probably the most complex of all systems. It is also highly coupled, with changes in one area impacting elsewhere in unforeseen ways. Adding safeguards and increasing regulation will, again, not protect us from failure. It merely increases complexity, making failure more likely. The only viable solution is to remove complexity by standardizing and simplifying processes. And minimizing interference with natural market forces.
The science of economic engineering is highly overrated. If similar safety standards were applied to other complex systems such as aircraft design, engineers would not bother to fit landing gear. Because every engineered take-off inevitably leads to a crash.
Gold
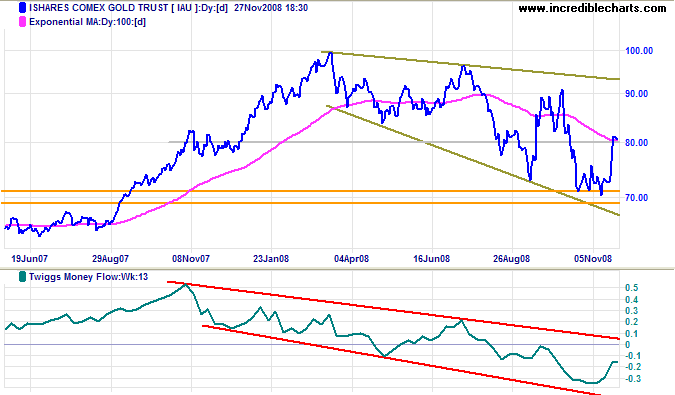
Spot gold retraced to test the new support level at $800. Respect would signal a rally to the upper border of the descending broadening wedge formation, while failure would indicate another test of $700. The primary trend is down, and breakout below 700 would offer a target of $550, the June 2006 low.
Baltic Dry Index
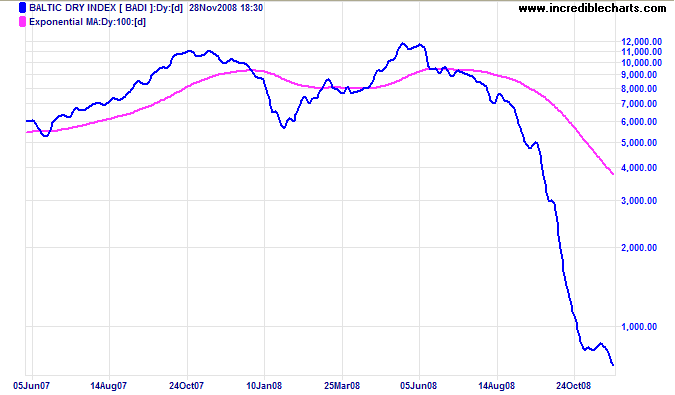
The Baltic Dry Index reflects international trade, especially bulk commodity shipments of iron ore and coal. The index commenced another down-swing after a brief consolidation, warning that commodity exports from Australia, South Africa and Brazil, will continue to fall.
Interbank Lending
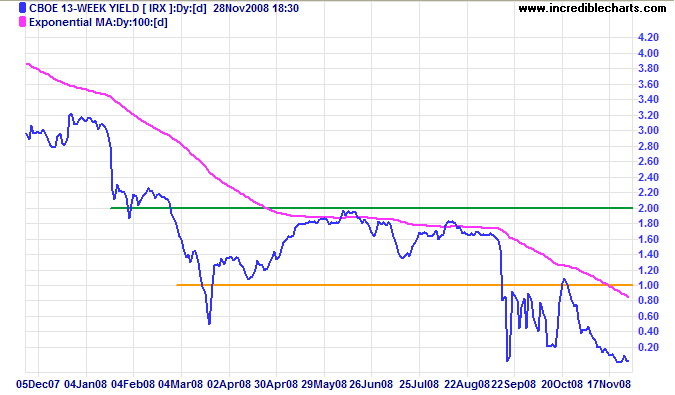
Yields on 3-month Treasury Bills are close to zero, signaling that uncertainty in financial markets remains high. Investors concerned about default risk prefer safety over yield.
USA
Dow Jones Industrial Average
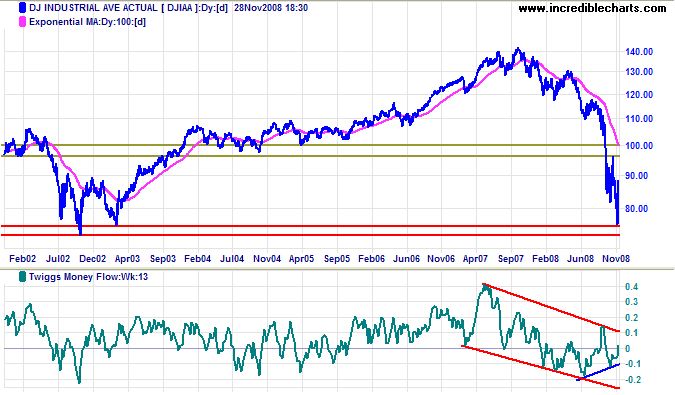
The Dow rally appears to be running out of steam, though declining volume may be partly attributable to Thanksgiving weekend. Breakout above medium-term resistance at 9000 would signal another test of 10000. Reversal below 8000 is more likely, however, and would warn of another down-swing.
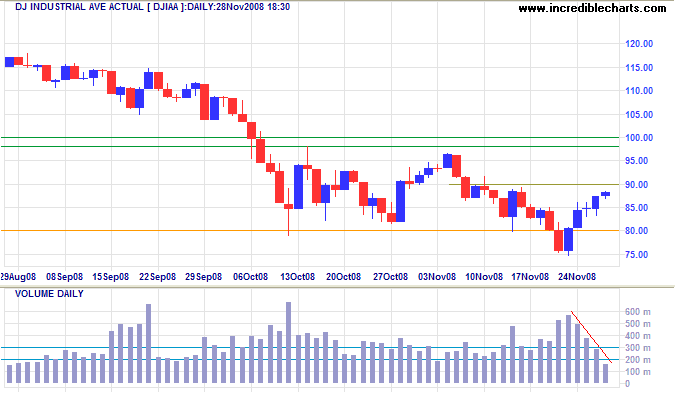
Long Term: The primary trend is down and penetration of the 2002 low of 7300 would offer a long-term target of 6000. This is calculated as 8000 - ( 10000 - 8000 ). Twiggs Money Flow (13-Week) shows a bullish divergence, but is yet to be confirmed by breakout from the downward trend channel. Recovery above 10000 is unlikely in the present climate.
S&P 500
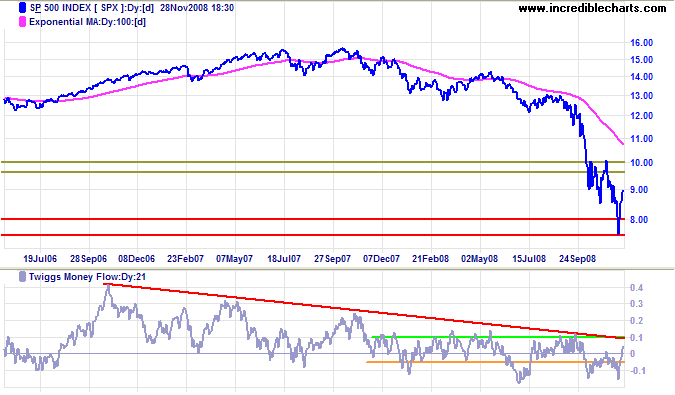
The S&P 500 is testing medium-term resistance at 900. Breakout would signal a test of 1000, while respect would warn of another test of 750. Twiggs Money Flow (21-Day) below the long-term declining (red) trendline continues to indicate weakness. In the long term, the primary trend is down and reversal below 750 would offer a target of 600; calculated as 750 - (900 - 750).
Transport
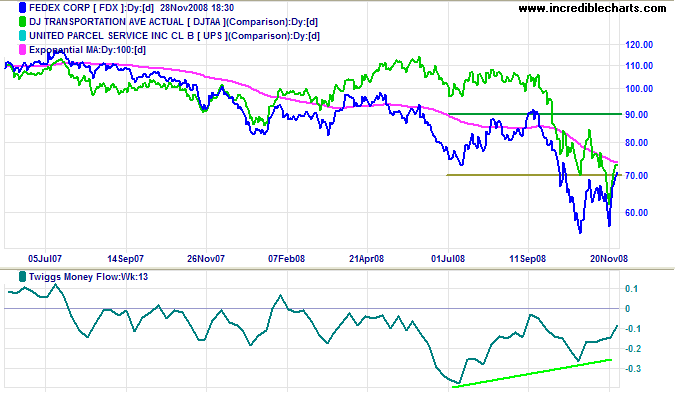
Fedex completed a double bottom reversal, breaking through resistance at $70.00 — reflecting lower fuel prices. Another higher trough would confirm the up-trend, normally an early pointer to economic recovery. The Transport Average remains in a primary down-trend, however, for the present.
Canada: TSX
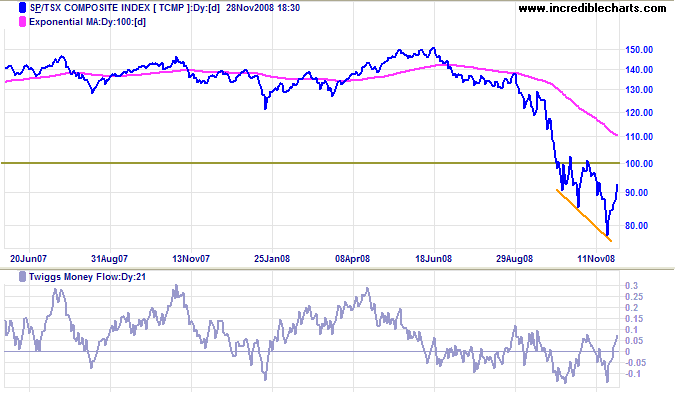
The TSX Composite broke through medium-term resistance at 9000 and is headed for a test of 10000, the upper border of a right-angled descending wedge formation. Twiggs Money Flow whipsawing around the zero line indicates uncertainty. Upward breakout would signal a primary trend reversal. Downward breakout would offer a target of 6000, calculated as 8000 - (10000 - 8000).
United Kingdom: FTSE
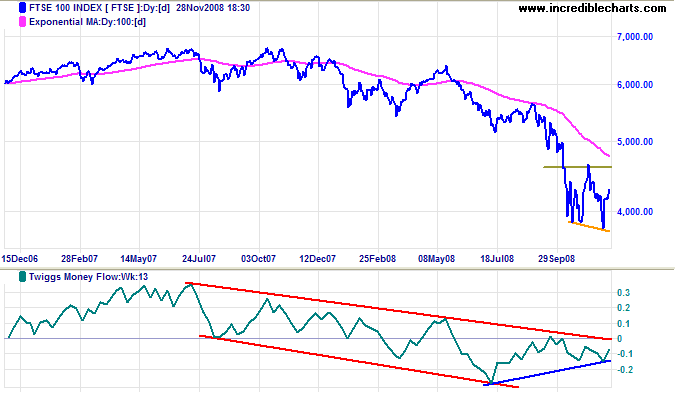
The FTSE 100 is also consolidating in a broadening wedge pattern, though there could be some argument whether the pattern is right-angled (with resistance in a horizontal line) or not. Twiggs Money Flow (13-week) displays a bullish divergence that would be completed if TMF breaks out of the descending trend channel. In the long term, breakout above 4600 would offer a target of 5600, the September 2008 high; while breakout below the lower border would offer a target of 3000, calculated as 3800 - (4600 - 3800).
Europe: DAX
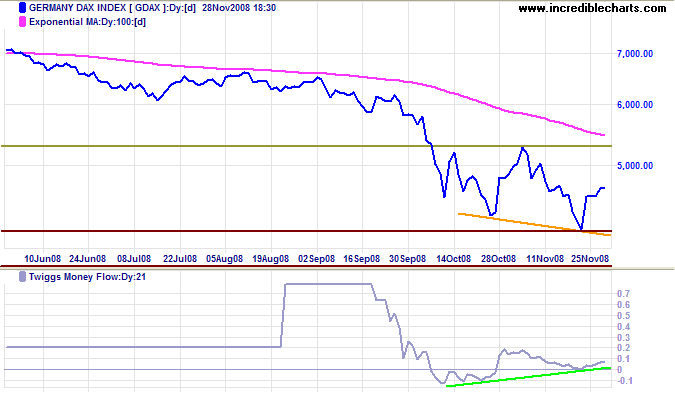
The DAX displays a similar broadening wedge and bullish divergence on Twiggs Money Flow. Upward breakout would offer a target of 6500, calculated as 5300 + (5300 - 4100); while downward breakout would suggest a target of 3000, calculated as 4200 - (5300 - 4100).
India: Sensex
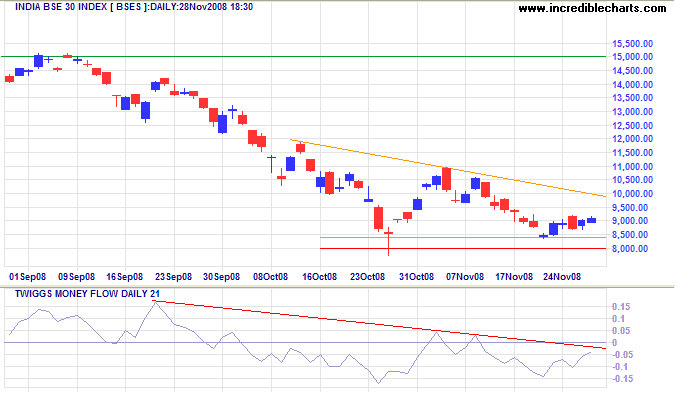
The Sensex displays a bearish descending triangle, while Twiggs Money Flow (21-Day) holds below zero, indicating weakness. The primary trend is down and breakout below 8000 would offer a target of 6000, the 2005 low; calculated as 8500 - ( 11000 - 8500 ). Reversal above 11000 is unlikely in the present climate.
Japan: Nikkei
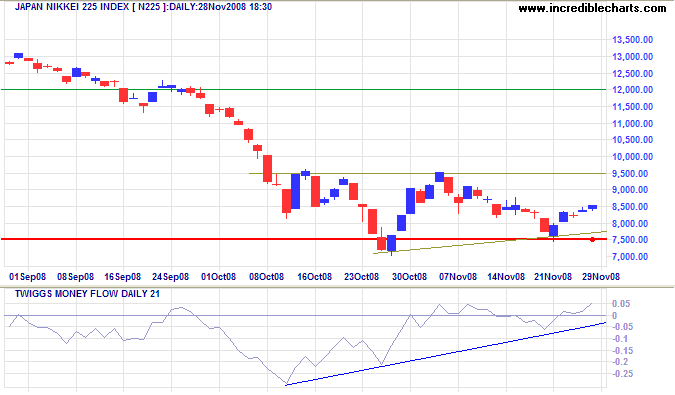
The Nikkei 225 bullish divergence on Twiggs Money Flow (21-Day) indicates medium-term buying pressure. Breakout above 9500 would signal a test of 12000. In the long term, the primary trend is down and reversal below 7500 would offer a target of 4500, calculated as 7000 - (9500 - 7000).
China
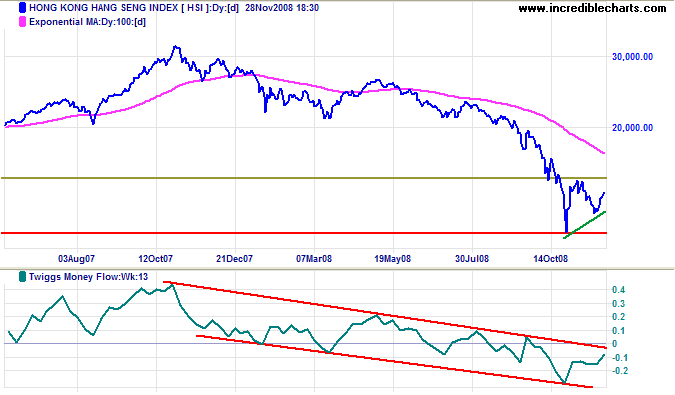
The Hang Seng continues in a strong downward Twiggs Money Flow (13-week) trend channel. Breakout above 15000, however, would complete a primary trend reversal. Downward breakout from the triangle would offer a target of the 2003 low of 8500.
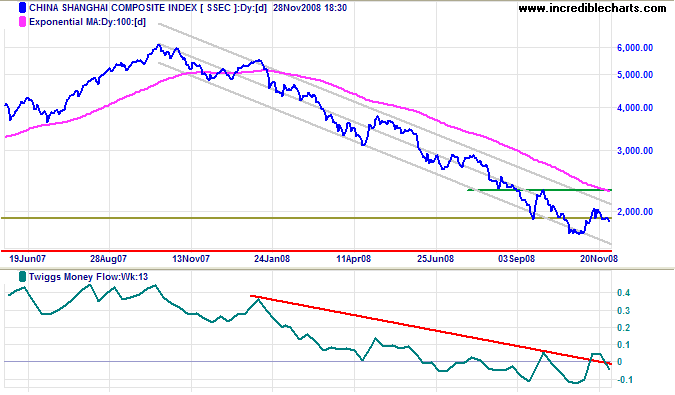
The Shanghai Composite is headed for another test of 1650, after twice respecting resistance at 2000. Twiggs Money Flow (13-week) below the falling trendline continues to display long-term weakness. In the long term, continuation of the primary down-trend is likely. Breakout below 1650 would offer a target of 1300; calculated as 1650 - (2000 - 1650).
Australia: ASX
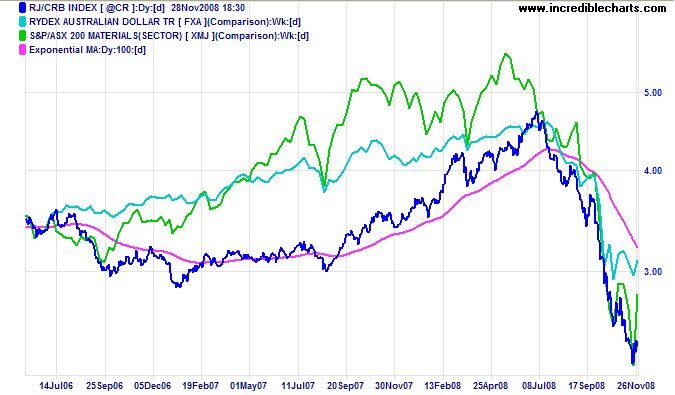
The CRB commodities index retraced slightly but continues to lead the way, ahead of the Aussie dollar and ASX Materials sector. Expect further weakness in all three.
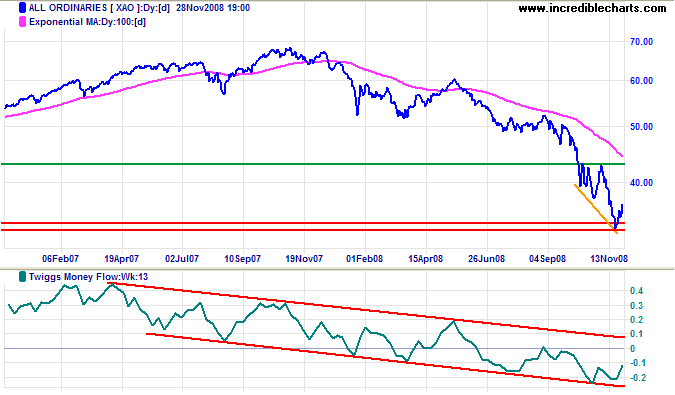
The All Ordinaries is testing the new resistance level at 3700, accompanied by low volume. Respect would signal continuation of the down-swing to 2700. Failure would indicate another test of 4300.
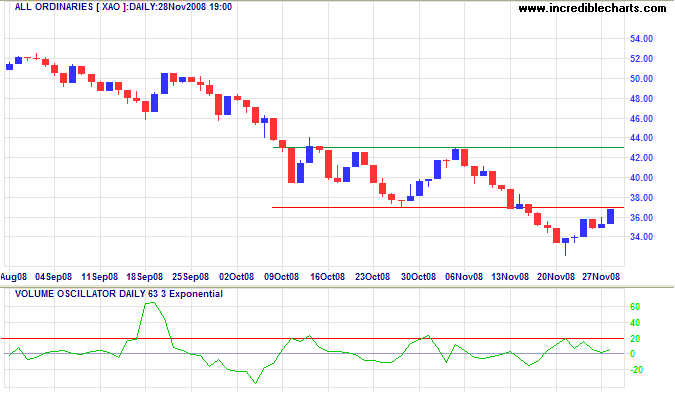
Long Term: Twiggs Money Flow (13-week) remains in a strong downward trend channel. The primary down-trend is likely to continue and breakout below 3300 would confirm the target of 2700, the 2003 low.
I have... instituted systematic, voluntary measures of cooperation with the business institutions and with State and municipal authorities
to make certain that fundamental businesses of the country shall continue as usual, that wages and therefore consuming power shall not be reduced,
and that a special effort shall be made to expand construction work in order to assist in equalizing other deficits in employment...
I am convinced that through these measures we have reestablished confidence. Wages should remain stable.
A very large degree of industrial unemployment and suffering which would otherwise have occurred has been prevented.
Agricultural prices have reflected the returning confidence. The measures taken must be vigorously pursued until normal conditions are restored.
~ Herbert Hoover, 31st President of the United States:
State of the Union Address, December 3, 1929

Author: Colin Twiggs is a former investment banker with almost 40 years of experience in financial markets. He co-founded Incredible Charts and writes the popular Trading Diary and Patient Investor newsletters.
Using a top-down approach, Colin identifies key macro trends in the global economy before evaluating selected opportunities using a combination of fundamental and technical analysis.
Focusing on interest rates and financial market liquidity as primary drivers of the economic cycle, he warned of the 2008/2009 and 2020 bear markets well ahead of actual events.
He founded PVT Capital (AFSL No. 546090) in May 2023, which offers investment strategy and advice to wholesale clients.
