Consumer Spending Declines
By Colin Twiggs
November 15, 5:00 a.m. ET (8:00 p.m. AET)
These extracts from my trading diary are for educational purposes and should not be interpreted as investment or trading advice. Full terms and conditions can be found at Terms of Use.
US retail sales fell 2.8% in October, according to the Commerce Department. While a sizable portion can be attributed to falling gas prices and declining auto sales, the contraction was widespread. There are four major concerns facing consumers: falling house prices; a resultant rise in debt levels relative to their net worth; rising unemployment and the threat of lay-offs; and higher credit card interest rates and lack of access to new credit. All are restraining consumer spending. Any savings from lower gas prices, as a result, will go towards paying off debt rather than financing new purchases. Faith in the ever-lasting boom is now seriously fractured and consumers are likely to adopt a more conservative outlook, paying off debt and increasing savings.
Declining consumer spending will cause a recession in most global economies — and don't expect a short V-bottom. Politicians will attempt to create the illusion that the boom is back: supressing interest rates to discourage savings and encourage borrowing. But consumers are unlikely to fall for that trick too soon.
The risk is that lower consumer spending starts a downward spiral, with lower sales resulting in further job cuts, which in turn causes further falls in spending. Government response to this is generally big spending programs, especially on infrastructure, but these can either debase the currency if funded through a budget deficit, or hurt consumer spending if funded through increased taxes. The consumer is the backbone of the economy and the quickest, safest route to restore stability to the market place. Encourage consumers to save on energy costs by offering rebates on electric or alternative energy automobiles, use of public transport systems, and other energy-saving devices. That way you can use the new savings ethic to actually stimulate spending, while reducing reliance on oil imports.
Interbank Spreads
The NYFR-OIS 1-month spread fell to 1.0 percent, and appears headed for a return to the normal margin of 50 basis points (0.50%). Fed injection of close to a trillion dollars in the last two months, and interposing itself as intermediary in the interbank market, is finalling breaking the gridlock. But this does not mean that markets have returned to normal — they remain on life support.
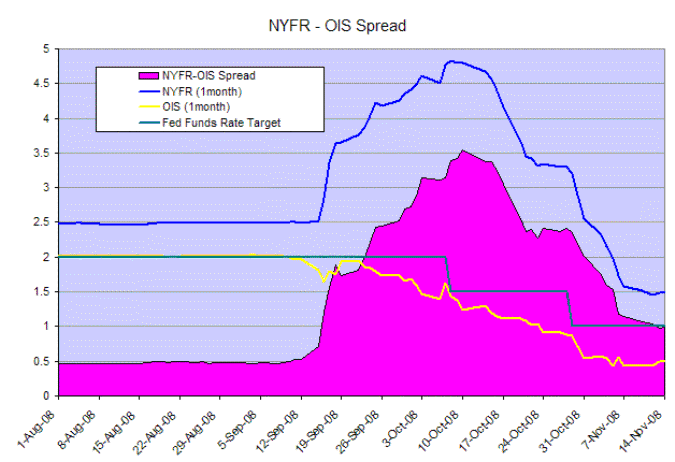
The NYFR is a broader, independent alternative to LIBOR, while the overnight index swap rate (OIS) reflects traders' expectations of the overnight fed funds rate. The 0.50 percent spread between the OIS and the fed funds target rate points to another rate cut.
Crude Oil
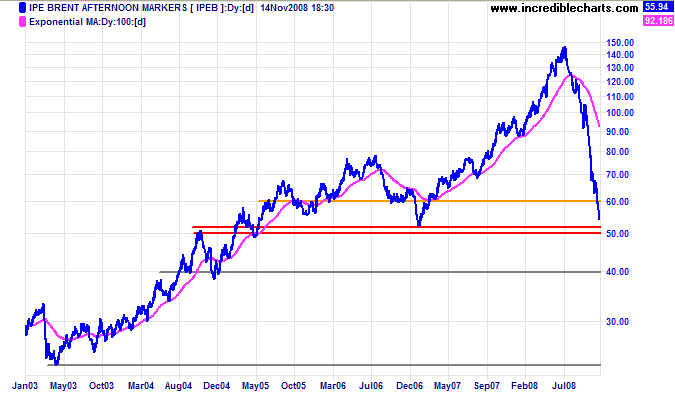
Crude oil is headed for a test of support at $50 per barrel. Expect further production cuts from OPEC, but these are unlikely to succeed in reversing the down-trend — as the global economy heads into recession. Failure of support would test the December 2004 low of $40/barrel, but the long term base could be as low as the 2003 low of $25.
USA
Dow Jones Industrial Average
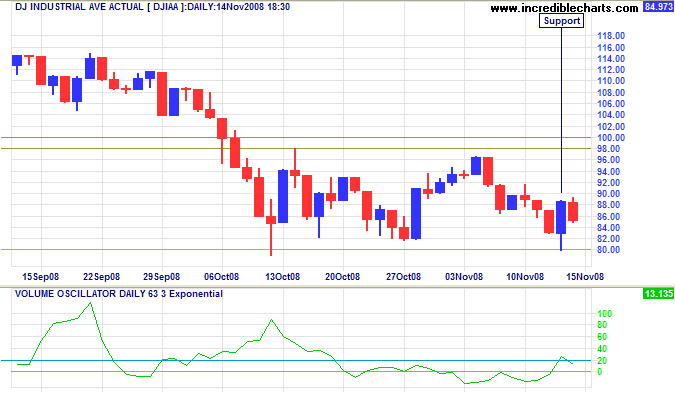
The Dow found buying support on Thursday, accompanied by an upsurge in volume. There was no follow-through above 9000 on Friday, however, and volume levels are weak when compared to support in early October. The broad consolidation between 8000 and 9800 is likely to resolve in a downward direction, with initial support at the 2003 low of 7500. Be wary of any sharp sucker rally: they are likely to fail just as quickly.
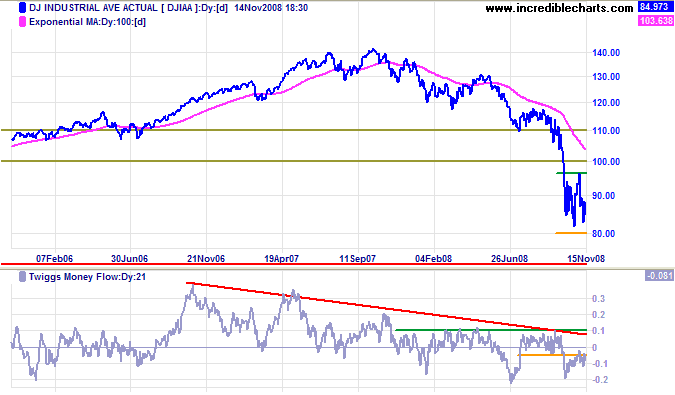
Long Term: The primary trend is down and breakout below 8000 would offer long-term target of 6000, last seen in October 1996. This is calculated as 8000 - ( 10000 - 8000 ). Twiggs Money Flow (21-Day) holding below zero confirms medium-term selling pressure. Recovery above 10000 is unlikely in the present climate.
S&P 500
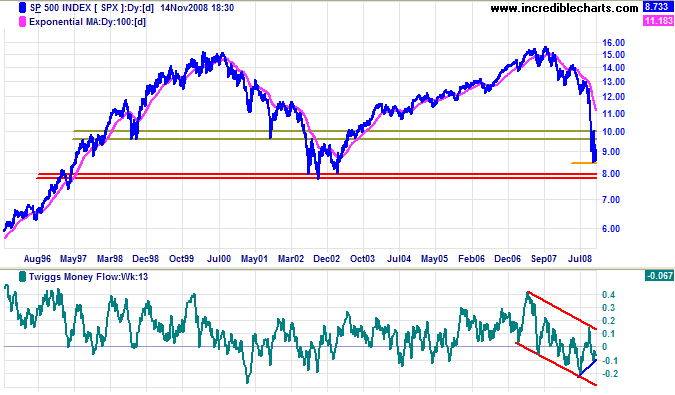
The S&P 500 is again testing support at 840. Twiggs Money Flow (13-week) is below zero and in a downward trend channel; breakout below the short-term (blue) trendline would warn of increased selling pressure. Failure of support is likely, which would test the 2002/2003 lows at 800, but the target is calculated as 850 - ( 1000 - 850 ) = 700.
Small Caps
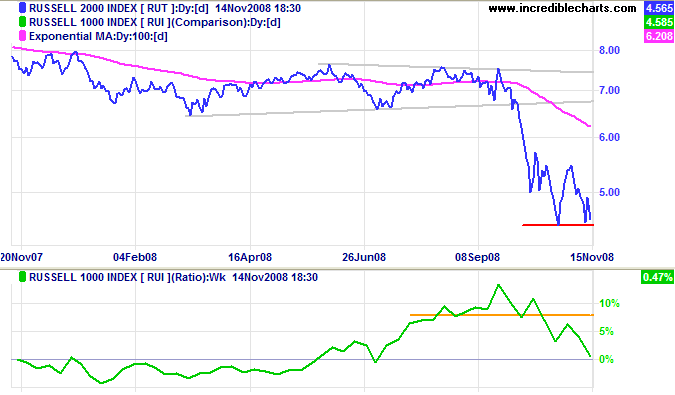
The Russell 2000 Small Caps index is testing support at 450. Failure would offer a target of 350; calculated as 450 - ( 550 - 450 ). The ratio to the large cap Russell 1000 is falling, as the credit contraction shifts from Wall Street to Main Street.
Technology
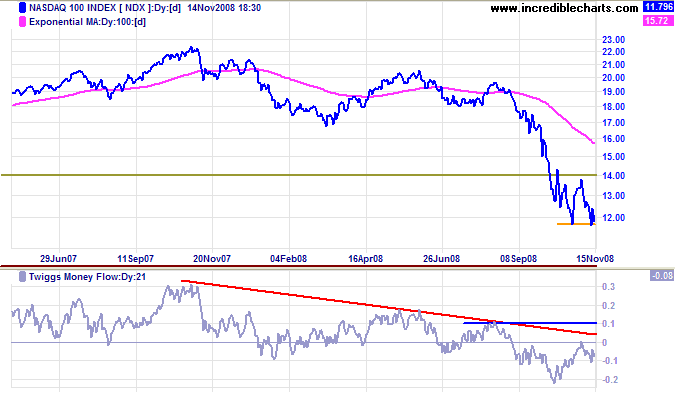
The Nasdaq 100 is testing support at 1150. Twiggs Money Flow (21-day) holding below zero signals selling pressure. Failure of support would offer a target of 1000, calculated as 1200 - ( 1400 - 1200 ).
Canada: TSX
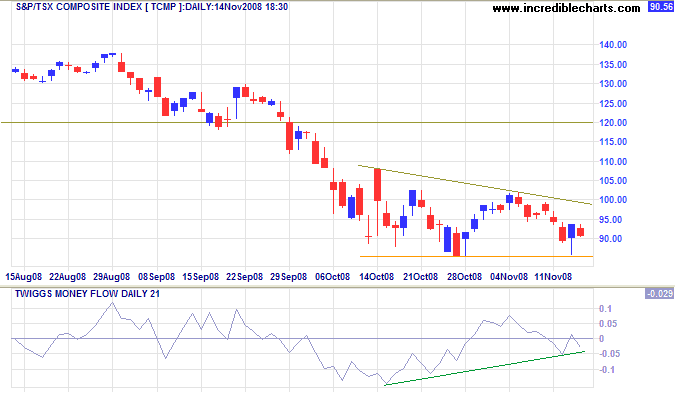
The TSX Composite shows a bearish descending triangle above 8500.
Thursday's rally is evidence of buying support but this failed to follow through above 9500.
Twiggs Money Flow (13-week) respecting zero from below warns of short-term selling pressure.
Reversal below 8500 is likely and would test the August 2004 low at 8000.
The calculated target is even lower at 7000;
that is 9000 - ( 11000 - 9000).
United Kingdom: FTSE
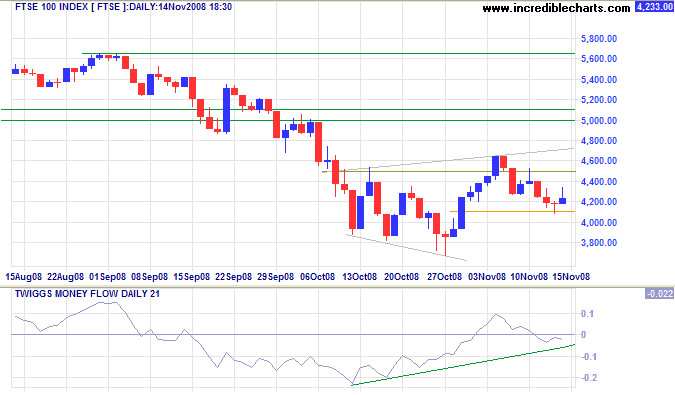
The FTSE 100 found short-term support at 4100. Reversal above 4500 would signal an upward breakout from the broadening wedge pattern, with a likely target of 5000. Twiggs Money Flow (21-day), however, has reversed below zero, and penetration of 4100 would test the lower wedge border.
Europe: DAX
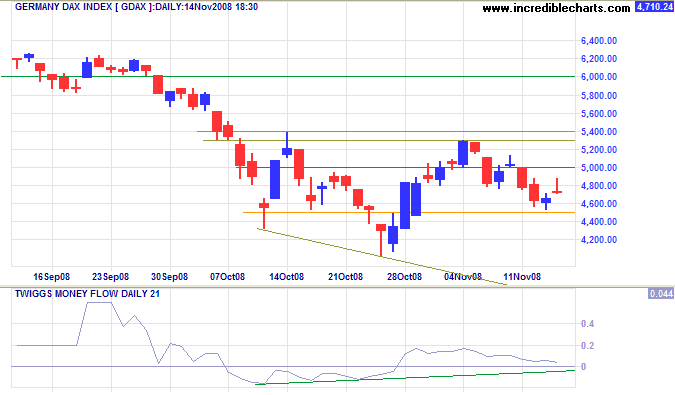
The DAX displays a descending right-angled broadening wedge, with the upper border at 5300. Reversal above 5000 would warn of an upward breakout, with a likely target of 6000, while failure of short-term support at 4500 would test the lower border of the wedge — near the August 2004 low of 3600. Twiggs Money Flow (21-Day) respecting the zero line would confirm buying pressure. The primary trend, however, continues downward.
India: Sensex
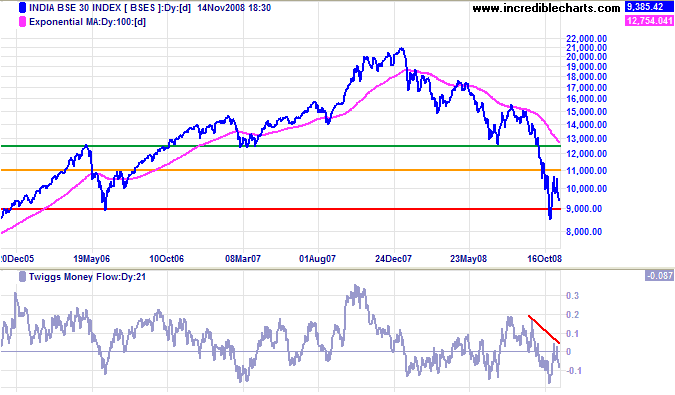
The Sensex is headed for another test of support at 9000. Twiggs Money Flow (21-Day) holding below zero indicates selling pressure. Expect a downward breakout to test 8000 in the short/medium-term, but the calculated target is 6000, the 2005 low. That is 8500 - ( 11000 - 8500 ). Reversal above 11000 is unlikely in the present climate.
Japan: Nikkei
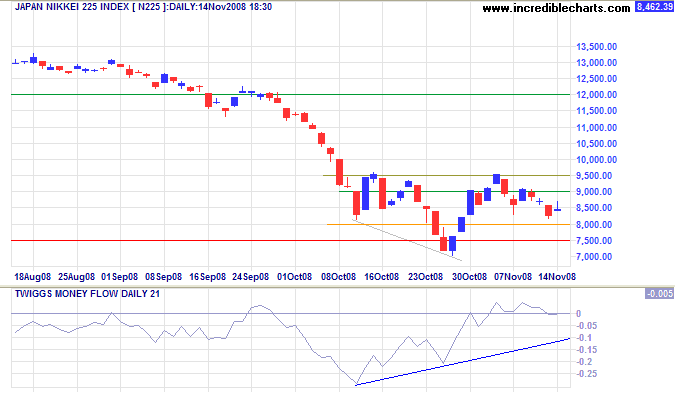
The Nikkei 225 displays a descending right-angled broadening wedge, similar to the DAX, but the dominant feature on the chart is the long-term support level of 7500, the 2003 low. Reversal above 9000 would suggest an upward breakout with a target of 12000, calculated as 9500 + (9500 - 7000). Failure of short-term support at 8000 would indicate another test of 7500. Twiggs Money Flow (21-Day) whipsawing around the zero line signals uncertainty. A fall below the October low of 7000 would warn of another down-swing, with a target of 4500, calculated as 7000 - (9500 - 7000).
China
The Wall Street Journal reports that the volume of electricity generated fell by 4 percent in October, the first such decline in a non-holiday month in over a decade. A sign that heavy industry, and consequently commodity imports, are slowing.
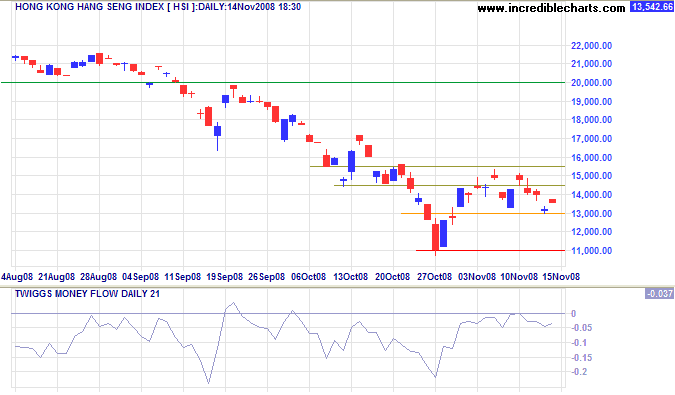
The Hang Seng index rallied after the recent announcement of a major economic stimulus package, testing resistance around 15000 before retracing to test short-term support at 13000. Twiggs Money Flow (21-Day) is holding below zero, indicating selling pressure, and failure of support would signal another test of 11000. Breakout above 15000, while less likely, would offer a short-term target of 17000. In the long term, the primary trend is down and failure of support at 11000 would warn of a test of the 2003 low at 8500.
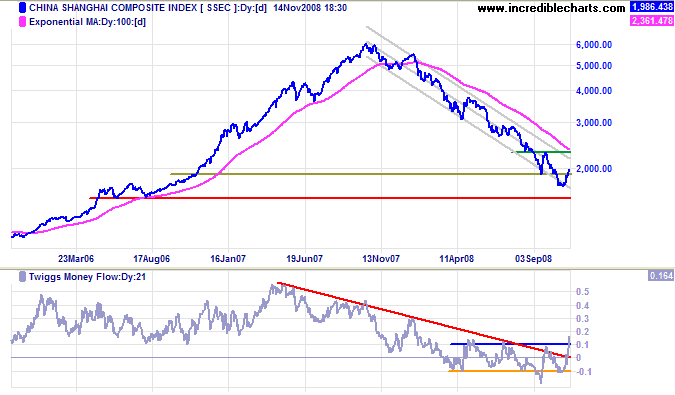
The Shanghai Composite rallied to 2000, while Twiggs Money Flow (21-day) signals strong short-term buying pressure. Expect a test of the upper trend channel, but breakout, on its own, would be an unreliable signal. We would need a higher secondary low, say respecting 1800, to signal a primary trend change. And, with global demand dropping, I do not see that happening.
Australia: ASX
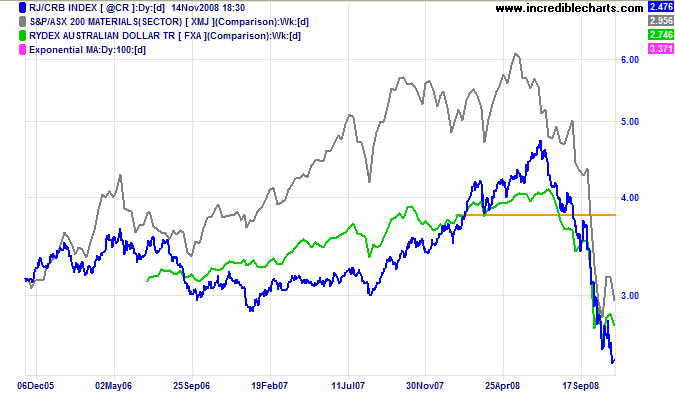
The CRB commodities index continues to fall. The Australian dollar is lagging at present, but expect further weakness. The ASX mining sector is following.
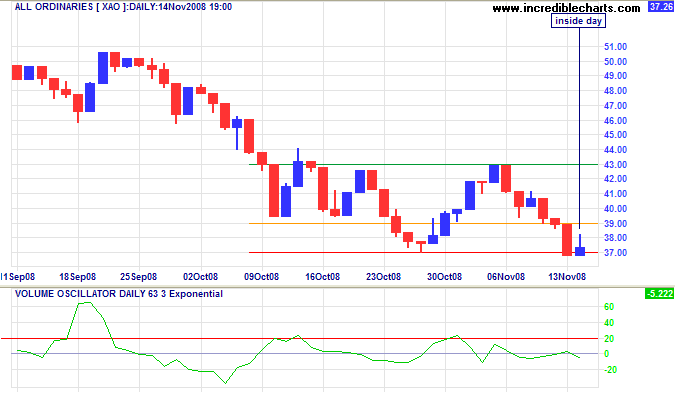
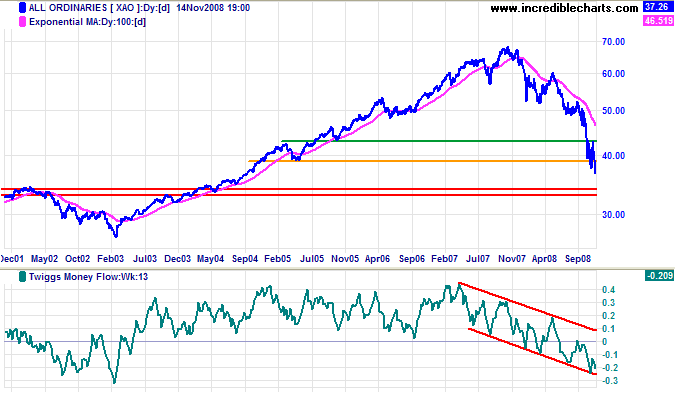
The All Ordinaries made a failed break below 3700,
but the recovery is unconvincing:
a weak close and light volume, ending with an inside day.
Follow-through above 3900 would rectify this, signaling another test of 4300.
Reversal below 3700, however, would offer a target of 3100;
calculated as
3700 - ( 4300 - 3700 ).
Long Term: The prospects of the mining sector look bleak, with exports and prices falling; while the property, construction and banking sector will continue to suffer from the global credit contraction. Twiggs Money Flow (13-week) index is in a strong downward trend channel. Expect support between 3300 and 3400: the 50 percent retracement level.
The major difference between a thing that might go wrong
and a thing that cannot possibly go wrong
is that when a thing that cannot possibly go wrong goes wrong
it usually turns out to be impossible to get at and repair.
~ Douglas Adams

Author: Colin Twiggs is a former investment banker with almost 40 years of experience in financial markets. He co-founded Incredible Charts and writes the popular Trading Diary and Patient Investor newsletters.
Using a top-down approach, Colin identifies key macro trends in the global economy before evaluating selected opportunities using a combination of fundamental and technical analysis.
Focusing on interest rates and financial market liquidity as primary drivers of the economic cycle, he warned of the 2008/2009 and 2020 bear markets well ahead of actual events.
He founded PVT Capital (AFSL No. 546090) in May 2023, which offers investment strategy and advice to wholesale clients.
